PDF下载 ( 750 KB)

肝硬化发生骨量丢失的临床特征及其与肌少症的相关性
DOI: 10.3969/j.issn.1001-5256.2023.12.013
Clinical features of bone mass loss in liver cirrhosis and its association with sarcopenia
-
摘要:
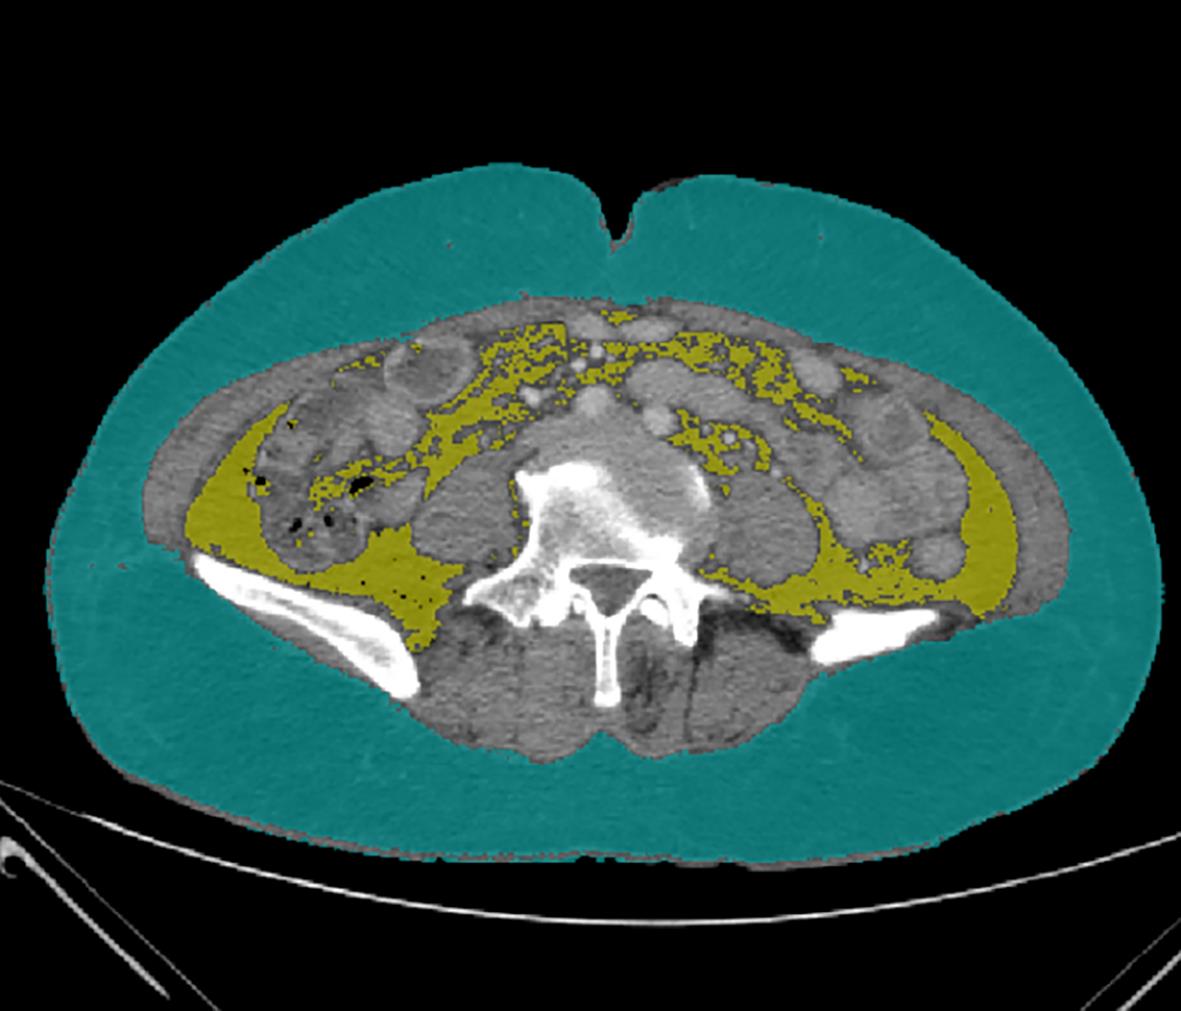
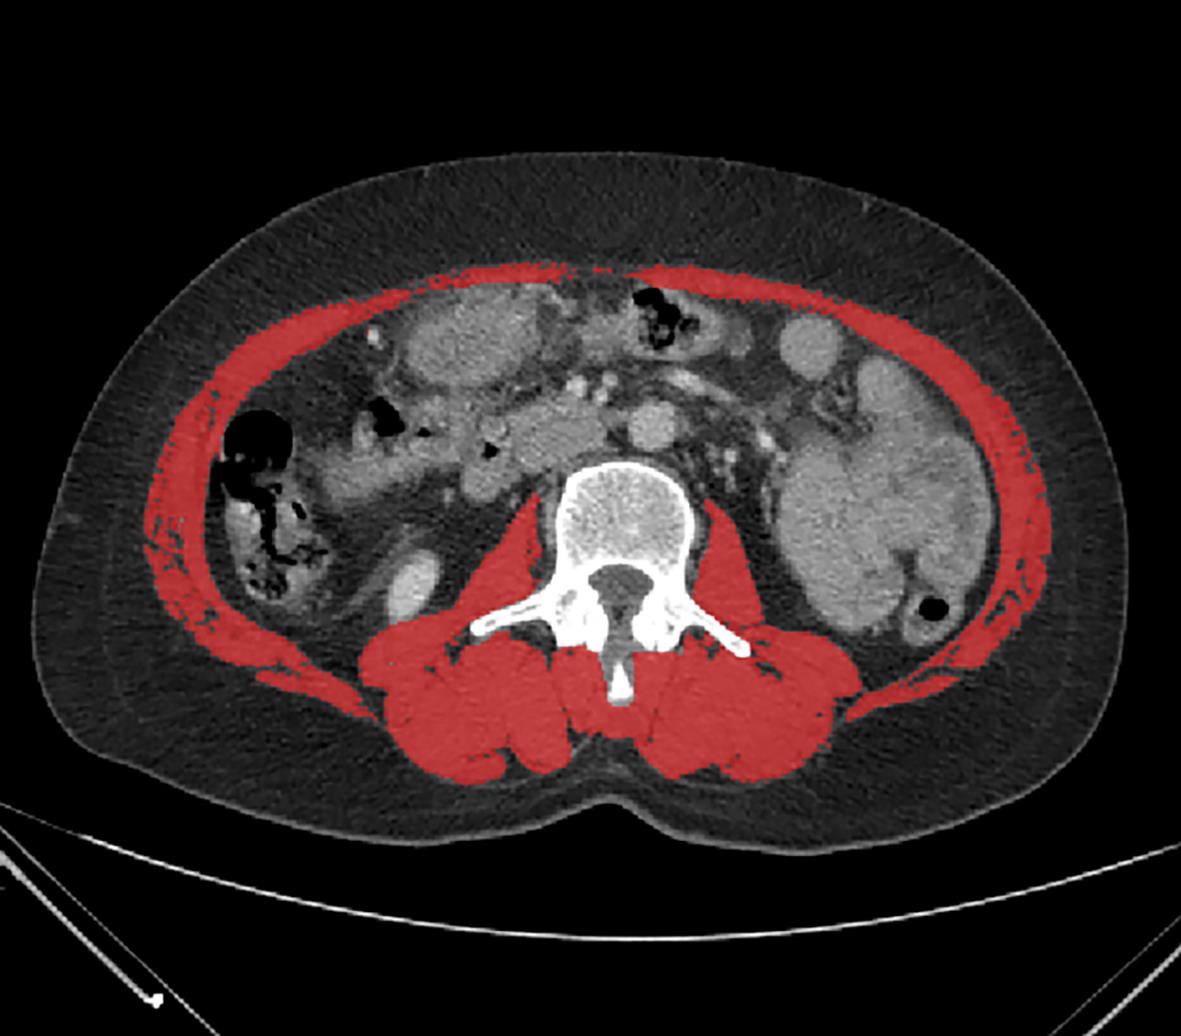
目的 通过对比肝硬化患者发生骨量丢失的临床特征,探讨肌少症对发生骨量丢失的影响、识别肝硬化骨量丢失的危险因素以及探讨人体成分分析与骨密度之间的相关性。 方法 选取2022年4月—2022年12月于昆明医科大学第二附属医院消化内科住院并确诊肝硬化的患者92例。根据双能X线吸收检测法(DXA),分为骨量丢失组(骨量减少/骨质疏松)(57例)和骨量正常组(35例),比较两组间的一般资料、实验室检查、影像学资料和人体成分分析的差异。计量资料两组间比较采用成组t检验或Mann-Whitney U检验,计数资料两组间比较采用χ2检验或连续性修正χ2检验;相关性分析采用Pearson相关性分析或Spearman相关性分析;Logistic回归分析肝硬化发生骨量丢失的危险因素。 结果 骨量丢失组的年龄(t=-3.597)、女性占比(χ2=8.393)、骨钙素N端中分子片段(N-MID)(Z=-3.068)、β-I型胶原羧基末端交联肽(β-CTX)(t=-2.784)和肌少症占比(χ2=13.884)高于骨量正常组,降钙素(CT)(Z=-2.340)和L3-骨骼肌指数(L3-SMI)(t=4.621)低于骨量正常组(P值均<0.05),骨量丢失组的肌肉总量(Z=-2.952)、右上肢肌肉量(Z=-2.929)、左上肢肌肉量(Z=-2.680)、右下肢肌肉量(Z=-3.366)、左下肢肌肉量(Z=-3.374)、推定骨量(t=2.842)、身体水分量(Z=-2.779)、基础代谢率(BMR)(Z=-3.153)、L1~L4低骨密度(BMD)和股骨颈BMD(t=9.789、t=10.280、t=10.832、Z=-7.298、t=8.945)均低于骨量正常组(P值均<0.05)。人体成分分析的肌肉总量、躯干部及四肢肌肉量、推定骨量、BMR、身体水分量与L1~L4 BMD和股骨颈BMD呈正相关(P值均<0.05),脂肪量与L1~L4 BMD呈正相关(P值均<0.05)。肌少症(OR=8.737,95%CI:2.237~34.129,P=0.002)、年龄(OR=1.094,95%CI:1.019~1.175,P=0.013)、N-MID(OR=1.095,95%CI:1.019~1.176,P=0.014)是肝硬化发生骨量丢失的独立危险因素。 结论 高龄、女性、合并肌少症、N-MID升高、β-CTX升高、CT降低、低肌肉量、低推定骨量、低BMR和低身体水分量是肝硬化发生骨量丢失的特征,肌少症、年龄和N-MID是肝硬化骨量丢失的独立危险因素,通过详细评估人体成分变化有助于发现肝硬化患者的骨密度异常。 Abstract:Objective To investigate the influence of sarcopenia on bone mass loss, the risk factors for bone mass loss in liver cirrhosis, and the correlation between body composition and bone mineral density (BMD) by comparing the clinical features of bone mass loss in patients with liver cirrhosis. Methods A total of 92 patients who were hospitalized and diagnosed with liver cirrhosis in Department of Gastroenterology, The Second Affiliated Hospital of Kunming Medical University, from April to December of 2022 were enrolled, and based on the results of dual-energy X-ray absorptiometry, they were divided into bone mass loss group (osteopenia/osteoporosis) with 57 patients and normal bone mass group with 35 patients. The two groups were compared in terms of general data, laboratory examination, imaging data, and body composition analysis. The independent samples t-test or the Mann-Whitney U test was used for comparison of continuous data between two groups, and the chi-square test or the continuity correction chi-square test was used for comparison of categorical data between two groups; Pearson correlation analysis and Spearman correlation analysis were used to investigate correlation; a binary logistic regression analysis was used to investigate the risk factors for bone mass loss in liver cirrhosis. Results Compared with the normal bone mass group, the bone mass loss group had significantly higher age (t=-3.597, P<0.05), proportion of female patients (χ2=8.393, P<0.05), N-terminal middle molecular fragment of osteocalcin (N-MID) (Z=-3.068, P<0.05), β isomer of C-terminal telopeptide of type I collagen (β-CTX) (t=-2.784, P<0.05), and proportion of patients with sarcopenia (χ2=13.884, P<0.05) and significantly lower calcitonin (CT) (Z=-2.340, P<0.05) and L3 skeletal muscle index (L3-SMI) (t=4.621, P<0.05). Compared with the normal bone mass group, the bone mass loss group had significantly lower total muscle mass (Z=-2.952, P<0.05), right upper limb muscle mass (Z=-2.929, P<0.05), left upper limb muscle mass (Z=-2.680, P<0.05), right lower limb muscle mass (Z=-3.366, P<0.05), left lower limb muscle mass (Z=-3.374, P<0.05), presumed bone mass (t=2.842, P<0.05), body water mass (Z=-2.779, P<0.05), basal metabolic rate (BMR) (Z=-3.153, P<0.05), and BMD of L1— L4 and femoral neck (t=9.789, t=10.280, t=10.832, Z=-7.298, t=8.945, all P<0.05). Total muscle mass, muscle mass of trunk and limbs, presumed bone mass, BMR, and body water mass in body component analysis were positively correlated with L1 — L4 BMD and femoral neck BMD (all P<0.05), and fat mass was positively correlated with L1 — L4 BMD (all P<0.05). Sarcopenia (odds ratio [OR]=8.737, 95% confidence interval [CI]: 2.237 — 34.129, P=0.002), age (OR=1.094, 95%CI: 1.019 — 1.175, P=0.013), and N-MID (OR=1.095, 95%CI: 1.019 — 1.176, P=0.014) were independent risk factors for bone mass loss in patients with liver cirrhosis. Conclusion Old age, female sex, sarcopenia, elevated N-MID, elevated β-CTX, reduction in CT, low muscle mass, low presumed bone mass, low BMR, and low body water mass are the features of bone mass loss in patients with liver cirrhosis, and sarcopenia, age, and N-MID are independent risk factors for bone mass loss in patients with liver cirrhosis. Detailed assessment of body composition changes can help to identify abnormal BMD in patients with liver cirrhosis. -
Key words:
- Liver Cirrhosis /
- Bone Density /
- Osteoporosis /
- Sarcopenia
-
表 1 两组间一般资料比较
Table 1. Comparison of general data between the two groups
项目 骨量丢失组(n=57) 骨量正常组(n=35) 统计值 P值 性别[例(%)] χ2=8.393 0.004 男 23(40.4) 25(71.4) 女 34(59.6) 10(28.6) 年龄(岁) 58.70±8.76 51.91±8.83 t=-3.597 0.001 BMI(kg/m2) 22.81±3.72 24.21±3.19 t=1.857 0.067 握力(kg) 16.2(13.0~26.0) 19.3(15.9~29.5) Z=-1.741 0.082 病因[例(%)] χ2=6.502 0.090 乙型肝炎 17(29.8) 17(48.6) 酒精性肝病 13(22.8) 10(28.6) 原发性胆汁性胆管炎 12(21.1) 2(5.7) 其他 15(26.3) 6(17.1) Child-Pugh分级[例(%)] χ2=1.439 0.487 A级 26(45.6) 15(42.9) B级 22(38.6) 11(31.4) C级 9(15.8) 9(25.7) 激素使用史[例(%)] 11(19.3) 3(8.6) χ2=1.934 0.164 TDF服用史[例(%)] 4(7.0) 4(11.4) χ2=0.121 0.7281) 吸烟史[例(%)] 16(28.1) 13(37.1) χ2=0.827 0.363 饮酒史[例(%)] 18(31.6) 14(40.0) χ2=0.678 0.410 高血压[例(%)] 11(19.3) 4(11.4) χ2=0.984 0.321 糖尿病[例(%)] 14(24.6) 6(17.1) χ2=0.701 0.402 注:1)为连续性修正χ2检验。  下载: 导出CSV
表 2 两组间实验室资料比较
Table 2. Comparison of laboratory data between the two groups
项目 骨量丢失组(n=57) 骨量正常组(n=35) 统计值 P值 白蛋白(g/L) 33.73±6.84 33.11±6.89 t=-0.418 0.677 ALT(U/L) 31.00(20.00~61.00) 31.00(19.00~70.00) Z=-0.434 0.664 AST(U/L) 41.00(27.50~87.50) 44.00(28.00~114.00) Z=-0.302 0.763 ALP(U/L) 121.00(81.50~157.00) 109.00(79.00~140.00) Z=-0.993 0.321 GGT(U/L) 54.00(29.50~157.50) 49.00(36.00~115.00) Z=-0.105 0.917 胆碱酯酶(U/L) 3 928.00(2 631.00~6 333.00) 3 457.00(2 404.00~6 114.00) Z=-0.591 0.554 TBil(μmol/L) 28.10(17.60~41.30) 27.50(18.40~42.20) Z=-0.072 0.942 TC(mmol/L) 4.03(3.25~5.10) 3.95(3.21~4.69) Z=-0.571 0.568 TG(mmol/L) 0.95(0.77~1.28) 1.04(0.74~1.42) Z=-0.676 0.499 钙(mmol/L) 2.13±0.14 2.09±0.12 t=-1.596 0.114 磷(mmol/L) 1.12(1.02~1.20) 1.08(0.99~1.26) Z=-0.555 0.579 PT(s) 14.80(13.80~16.85) 15.60(14.20~18.80) Z=-1.589 0.112 APTT(s) 38.70(33.70~43.05) 40.60(37.10~47.50) Z=-1.673 0.094 INR 1.18(1.10~1.38) 1.27(1.12~1.53) Z=-1.496 0.135 PTH(pg/mL) 41.55(28.45~59.61) 32.52(25.93~54.31) Z=-1.251 0.211 N-MID(ng/mL) 19.80(12.61~26.58) 11.89(8.21~19.26) Z=-3.068 0.002 β-CTX(pg/mL) 684.40±295.03 521.89±228.40 t=-2.784 0.007 CT(pg/mL) 0.85(0.50~1.68) 1.87(0.71~3.66) Z=-2.340 0.019 25羟基维生素D(nmol/L) 31.10(23.65~46.80) 30.80(20.60~49.30) Z=-0.253 0.800
下载: 导出CSV
表 3 两组间合并肌少症的情况比较
Table 3. Comparison of sarcopenia between the two groups
项目 骨量丢失组(n=57) 骨量正常组(n=35) 统计值 P值 L3-SMI(cm2/m2) 41.28±9.36 48.87±6.38 t=4.621 <0.001 肌少症[例(%)] 42(73.7) 12(34.3) χ2=13.884 <0.001
下载: 导出CSV
表 4 两组间人体成分分析、腹部脂肪面积和骨密度比较
Table 4. Comparison of body composition analysis, abdominal fat area and bone mineral density between the two groups
项目 骨量丢失组(n=57) 骨量正常组(n=35) 统计值 P值 体脂肪率(%) 23.91±8.49 23.94±9.21 t=0.015 0.988 脂肪量(kg) 14.05(9.55~18.60) 14.60(12.40~20.50) Z=-0.925 0.355 肌肉总量(kg) 39.95(36.00~49.68) 45.85(40.75~54.25) Z=-2.952 0.003 躯干部肌肉量(kg) 21.80(20.03~27.00) 24.30(21.35~27.50) Z=-1.705 0.088 右上肢肌肉量(kg) 1.95(1.70~2.68) 2.52(2.05~3.05) Z=-2.929 0.003 左上肢肌肉量(kg) 1.90(1.63~2.80) 2.50(2.00~2.90) Z=-2.680 0.007 右下肢肌肉量(kg) 7.10(5.95~9.38) 8.75(7.55~10.50) Z=-3.366 0.001 左下肢肌肉量(kg) 7.10(5.93~9.08) 8.85(7.35~10.30) Z=-3.374 0.001 推定骨量(kg) 2.47±0.44 2.72±0.36 t=2.842 0.006 BMR(kcal) 1 185.00(1 077.00~1 445.00) 1 407.00(1 242.00~1 569.00) Z=-3.153 0.002 身体水分量(kg) 30.45(27.33~37.23) 35.85(30.15~42.90) Z=-2.779 0.005 皮下脂肪面积(cm2) 149.20(93.42~192.45) 134.6(85.80~211.00) Z=-0.483 0.629 内脏脂肪面积(cm2) 67.51(34.57~114.65) 65.98(46.44~122.70) Z=-0.390 0.696 L1 BMD(g/cm2) 0.76±0.13 1.02±0.11 t=9.789 <0.001 L2 BMD(g/cm2) 0.82±0.14 1.11±0.12 t=10.280 <0.001 L3 BMD(g/cm2) 0.88±0.14 1.20±0.13 t=10.832 <0.001 L4 BMD(g/cm2) 0.90(0.80~0.98) 1.16(1.08~1.25) Z=-7.298 <0.001 股骨颈BMD(g/cm2) 0.75±0.11 0.95±0.10 t=8.945 <0.001
下载: 导出CSV
表 5 人体成分和骨密度的相关性分析
Table 5. Correlation analysis between body composition and bone mineral density
项目 L1 BMD L2 BMD L3 BMD L4 BMD 股骨颈BMD r值 P值 r值 P值 r值 P值 r值 P值 r值 P值 体脂肪率 0.070 0.506 0.040 0.704 0.051 0.630 0.065 0.535 0.009 0.933 脂肪量 0.230 0.028 0.209 0.046 0.213 0.042 0.267 0.010 0.123 0.243 肌肉总量 0.401 <0.001 0.438 <0.001 0.425 <0.001 0.412 <0.001 0.376 <0.001 躯干部肌肉量 0.322 0.002 0.336 0.001 0.284 0.006 0.276 0.008 0.271 0.009 右上肢肌肉量 0.371 <0.001 0.422 <0.001 0.408 <0.001 0.403 <0.001 0.353 0.001 左上肢肌肉量 0.348 0.001 0.379 <0.001 0.388 <0.001 0.380 <0.001 0.340 0.001 右下肢肌肉量 0.390 <0.001 0.450 <0.001 0.454 <0.001 0.442 <0.001 0.384 <0.001 左下肢肌肉量 0.391 <0.001 0.451 <0.001 0.457 <0.001 0.446 <0.001 0.378 <0.001 推定骨量 0.404 <0.001 0.413 <0.001 0.427 <0.001 0.399 <0.001 0.414 <0.001 BMR 0.436 <0.001 0.465 <0.001 0.464 <0.001 0.459 <0.001 0.402 <0.001 身体水分量 0.351 0.001 0.387 <0.001 0.405 <0.001 0.414 <0.001 0.371 <0.001
下载: 导出CSV
表 6 肝硬化骨量丢失危险因素的Logistic回归分析
Table 6. Logistic regression analysis of risk factors for bone mass loss in cirrhosis
项目 单因素分析 多因素分析 OR(95%CI) P值 OR(95%CI) P值 年龄(岁) 1.095(1.035~1.158) 0.001 1.094(1.019~1.175) 0.013 女性 3.696(1.496~9.129) 0.005 N-MID(ng/mL) 1.067(1.016~1.120) 0.009 1.095(1.019~1.176) 0.014 β-CTX(pg/mL) 1.002(1.001~1.004) 0.009 CT(pg/mL) 0.937(0.827~1.063) 0.313 肌少症 5.367(2.152~13.381) <0.001 8.737(2.237~34.129) 0.002 BMR(kcal) 0.997(0.995~0.999) 0.004 身体水分量(kg) 0.920(0.864~0.981) 0.011
下载: 导出CSV
-
[1] DANFORD CJ, TRIVEDI HD, BONDER A. Bone health in patients with liver diseases[J]. J Clin Densitom, 2020, 23( 2): 212- 222. DOI: 10.1016/j.jocd.2019.01.004. [2] ZHANG W, GONG H, SU ZC, et al. Risk factors associated with hepatic osteopathy in HBV related cirrhosis measured by liver stiffness: An Observational study[J]. Medicine, 2019, 98( 31): e16628. DOI: 10.1097/MD.0000000000016628. [3] Chinese Society of Hepatology, Chinese Medical Association. Chinese guidelines on the management of liver cirrhosis[J]. J Clin Hepatol, 2019, 35( 11): 2408- 2425. DOI: 10.3969/j.issn.1001-5256.2019.11.006.中华医学会肝病学分会. 肝硬化诊治指南[J]. 临床肝胆病杂志, 2019, 35( 11): 2408- 2425. DOI: 10.3969/j.issn.1001-5256.2019.11.006. [4] Chinese Society of Osteoporosis and Bone Mineral Research. Guidelines for the diagnosis and management of primary osteoporosis(2017)[J]. Chin J Osteoporos, 2019, 25( 3): 281- 309. DOI: 10.3969/j.issn.1006-7108.2019.03.001.中华医学会骨质疏松和骨矿盐疾病分会. 原发性骨质疏松症诊疗指南(2017)[J]. 中国骨质疏松杂志, 2019, 25( 3): 281- 309. DOI: 10.3969/j.issn.1006-7108.2019.03.001. [5] CAREY EJ, LAI JC, SONNENDAY C, et al. A North American expert opinion statement on sarcopenia in liver transplantation[J]. Hepatology, 2019, 70( 5): 1816- 1829. DOI: 10.1002/hep.30828. [6] ZHENG JP, MIAO HX, ZHENG SW, et al. Risk factors for osteoporosis in liver cirrhosis patients measured by transient elastography[J]. Medicine, 2018, 97( 20): e10645. DOI: 10.1097/MD.0000000000010645. [7] SAEKI C, TAKANO K, OIKAWA T, et al. Comparative assessment of sarcopenia using the JSH, AWGS, and EWGSOP2 criteria and the relationship between sarcopenia, osteoporosis, and osteosarcopenia in patients with liver cirrhosis[J]. BMC Musculoskelet Disord, 2019, 20( 1): 615. DOI: 10.1186/s12891-019-2983-4. [8] PERIYALWAR P, DASARATHY S. Malnutrition in cirrhosis: contribution and consequences of sarcopenia on metabolic and clinical responses[J]. Clin Liver Dis, 2012, 16( 1): 95- 131. DOI: 10.1016/j.cld.2011.12.009. [9] BENJAMIN J, SHASTHRY V, KAAL CR, et al. Characterization of body composition and definition of sarcopenia in patients with alcoholic cirrhosis: A computed tomography based study[J]. Liver Int, 2017, 37( 11): 1668- 1674. DOI: 10.1111/liv.13509. [10] CHEN Z, LI WY, HO M, et al. The prevalence of sarcopenia in Chinese older adults: Meta-analysis and meta-regression[J]. Nutrients, 2021, 13( 5): 1441. DOI: 10.3390/nu13051441. [11] TANDON P, MONTANO-LOZA AJ, LAI JC, et al. Sarcopenia and frailty in decompensated cirrhosis[J]. J Hepatol, 2021, 75( Suppl 1): S147- S162. DOI: 10.1016/j.jhep.2021.01.025. [12] LAI JC, TANDON P, BERNAL W, et al. Malnutrition, frailty, and sarcopenia in patients with cirrhosis: 2021 practice guidance by the American association for the study of liver diseases[J]. Hepatology, 2021, 74( 3): 1611- 1644. DOI: 10.1002/hep.32049. [13] SAEKI C, TSUBOTA A. Influencing factors and molecular pathogenesis of sarcopenia and osteosarcopenia in chronic liver disease[J]. Life, 2021, 11( 9): 899. DOI: 10.3390/life11090899. [14] ZHANG JY, TANG YM, LI JQ, et al. Risk factors for osteopenia/osteoporosis and the diagnostic value of CT value in patients with chronic hepatitis B[J]. J Clin Hepatol, 2022, 38( 5): 1041- 1047. DOI: 10.3969/j.issn.1001-5256.2022.05.013.张静怡, 唐映梅, 李嘉琦, 等. 慢性乙型肝炎患者骨量减少/骨质疏松的危险因素及CT值的诊断价值[J]. 临床肝胆病杂志, 2022, 38( 5): 1041- 1047. DOI: 10.3969/j.issn.1001-5256.2022.05.013. [15] PIÑAR-GUTIERREZ A, GARCÍA-FONTANA C, GARCÍA-FONTANA B, et al. Obesity and bone health: A complex relationship[J]. Int J Mol Sci, 2022, 23( 15): 8303. DOI: 10.3390/ijms23158303. [16] GKASTARIS K, GOULIS DG, POTOUPNIS M, et al. Obesity, osteoporosis and bone metabolism[J]. J Musculoskelet Neuronal Interact, 2020, 20( 3): 372- 381. [17] FAN JZ, JIANG YY, QIANG JL, et al. Associations of fat mass and fat distribution with bone mineral density in non-obese postmenopausal Chinese women over 60 years old[J]. Front Endocrinol, 2022, 13: 829867. DOI: 10.3389/fendo.2022.829867. [18] HSU WH, FAN CH, LIN ZR, et al. Effect of basal metabolic rate on the bone mineral density in middle to old age women in Taiwan[J]. Maturitas, 2013, 76( 1): 70- 74. DOI: 10.1016/j.maturitas.2013.05.016. [19] SOYSAL P, ATES BULUT E, YAVUZ I, et al. Decreased basal metabolic rate can be an objective marker for sarcopenia and frailty in older males[J]. J Am Med Dir Assoc, 2019, 20( 1): 58- 63. DOI: 10.1016/j.jamda.2018.07.001. [20] HONG XX, QIN LQ. Analysis on characteristics of human body composition and bone mineral density in healthy middle-aged men[J]. J Community Med, 2018, 16( 18): 1385- 1388.洪秀秀, 秦立强. 健康中年男性人体成分和骨密度特征分析[J]. 社区医学杂志, 2018, 16( 18): 1385- 1388. [21] ZHOU XZ, SONG XY, CHEN ZH, et al. Serum type I collagen amino terminal extender peptide and type I collagen carboxyl terminal peptide β Clinical value of special sequence and 25 hydroxyvitamin D3 level in early diagnosis of diabetes induced osteoporosis[J]. Clin J Med Offic, 2023, 51( 8): 854- 856, 860. DOI: 10.16680/j.1671-3826.2023.08.22.周信忠, 宋晓钰, 陈治浩, 等. 血清Ⅰ型胶原氨基端延长肽、Ⅰ型胶原羧基端肽β特殊序列、25羟维生素D3水平在糖尿病性骨质疏松早期诊断中临床价值[J]. 临床军医杂志, 2023, 51( 8): 854- 856, 860. DOI: 10.16680/j.1671-3826.2023.08.22. [22] MIGLIORINI F, MAFFULLI N, SPIEZIA F, et al. Potential of biomarkers during pharmacological therapy setting for postmenopausal osteoporosis: A systematic review[J]. J Orthop Surg Res, 2021, 16( 1): 351. DOI: 10.1186/s13018-021-02497-0. [23] QU XL, ZHENG B, CHEN TY, et al. Bone turnover markers and bone mineral density to predict osteoporotic fractures in older women: A retrospective comparative study[J]. Orthop Surg, 2020, 12( 1): 116- 123. DOI: 10.1111/os.12596. [24] JIANG YP, ZHOU J, JIAO LL, et al. Predictive value of biochemical indexes of bone metabolism in patients with posthepatitic cirrhosis complicated with osteoporosis[J]. Chin J Osteoporos Bone Miner Res, 2020, 13( 4): 326- 333. DOI: 10.3969/j.issn.1674-2591.2020.04.007.江雅平, 周佳, 焦莉莉, 等. 骨代谢生化指标对肝炎后肝硬化并发骨质疏松的预测价值[J]. 中华骨质疏松和骨矿盐疾病杂志, 2020, 13( 4): 326- 333. DOI: 10.3969/j.issn.1674-2591.2020.04.007. -

 本文二维码
本文二维码
计量
- 文章访问数: 269
- HTML全文浏览量: 97
- PDF下载量: 46
- 被引次数: 0