PDF下载 ( 1462 KB)

控制代谢危险因素对代谢功能障碍相关脂肪性肝病患者死亡风险的影响
DOI: 10.12449/JCH260714
Impact of metabolic risk factor control on mortality risk in patients with metabolic dysfunction-associated steatotic liver disease
-
摘要:
目的 评估综合控制多种代谢危险因素与代谢功能障碍相关脂肪性肝病(MASLD)患者全因死亡风险的关联及其量化效应。 方法 采用回顾性队列研究设计,选取美国国家健康与营养检查调查(NHANES)2003—2018年数据,共纳入29 458例参与者,其中MASLD患者(MASLD组)12 528例,非MASLD患者(非MASLD组)16 930例。综合评估9项危险因素:高血压、糖尿病、肝纤维化[纤维化-4指数(FIB-4)]、肝酶比值[天冬氨酸氨基转移酶/丙氨酸氨基转移酶(AST/ALT)比值]、血清白蛋白、肾功能(血清肌酐)、全身性炎症(中性粒细胞计数)、吸烟和体力活动状况。根据综合危险因素控制程度,MASLD患者被进一步分为低控制组(n=1 107)、中控制组(n=7 042)和高控制组(n=4 379)。外部验证队列共纳入397例参与者,其中MASLD组266例,非MASLD组131例。计量资料多组间比较采用Kruskal-Wallis H检验。计数资料组间比较采用χ2检验。采用Cox比例风险模型对NHANES数据应用复杂抽样权重,分析危险因素控制程度与全因死亡率的关系,并辅以Kaplan-Meier生存曲线、Log-rank检验、限制平均生存时间(RMST)及人群归因分值(PAF)进行评价。在外部独立临床验证队列(n=397)中重复分析以检验结论的稳健性。 结果 基于NHANES数据库的队列研究,中位随访6.7年,12 528例MASLD患者中共1 171例死亡。死亡风险随危险因素控制数量增加而显著降低(趋势检验χ2=65.06,P<0.001)。与低控制组相比,中控制组[风险比(HR)=0.59,95%置信区间(CI):0.51~0.69]和高控制组(HR=0.36,95%CI:0.27~0.48)死亡风险依次降低;每多控制1个因素,死亡风险降低22%(HR=0.78,95%CI:0.74~0.82)。PAF分析显示,AST/ALT比值控制(PAF=19.2%)与体力活动(PAF=18.9%)是贡献最大的因素。基于最近邻匹配构建的子队列(最长随访13.3年)的生存分析显示,不同控制水平的MASLD组与非MASLD组之间的累积生存率存在显著差异(P<0.001);RMST分析进一步量化了各组生存获益:高控制组10年RMST最长(9.88年),优于非MASLD组(9.43年)、中控制组(9.33年)和低控制组(7.96年)。在完整队列中进行的多变量调整模型显示,与非MASLD组相比,低控制组MASLD患者的死亡风险显著升高,中控制组的风险与之相当,而高控制组患者的死亡风险显著低于非MASLD组。亚组分析结果显示,综合控制的保护作用在男性和女性中均显著存在(P值均<0.05),且交互作用分析提示其对女性的保护作用可能更强(P交互=0.031);保护效应在≥60岁患者中具有统计学显著性(P值均<0.05);保护作用在不同腰围分层人群中具有统计学显著性(P值均<0.05),但组间无显著交互作用(P交互=0.821)。外部验证队列397例参与者中有72例(18.1%)全因死亡。生存分析结果显示,MASLD患者的生存率随控制水平提高呈现显著的梯度改善(P=0.022)。RMST分析显示,中、高控制组RMST在5年时均优于非MASLD组(4.47年 vs 4.56年 vs 4.40年),至10年时生存优势更为明显(8.67年 vs 8.95年 vs 8.44年)。Cox回归分析结果显示,以MASLD患者低控制组为参照,中控制组(HR=0.41,95%CI:0.21~0.81)和高控制组(HR=0.32,95%CI:0.14~0.71)死亡风险显著降低;以非MASLD组为参照,低控制组风险显著升高(HR=2.02,95%CI:1.03~3.95),中控制组(HR=0.83,95%CI:0.48~1.44)和高控制组(HR=0.66,95%CI:0.30~1.38)风险与之相当,且效应点估计值与主研究高度吻合。 结论 MASLD患者代谢危险因素控制越好,死亡风险越低。达到最佳控制水平可消除超额死亡风险,使患者生存预后优于普通人群。 -
关键词:
- 代谢功能障碍相关脂肪性肝病 /
- 代谢 /
- 危险因素
Abstract:Objective To investigate the association of comprehensive control of multiple metabolic risk factors with the risk of all-cause mortality in patients with metabolic dysfunction-associated steatotic liver disease (MASLD) and its quantitative effect. Methods A retrospective cohort study was conducted based on the data from National Health and Nutrition Examination Survey (NHANES) in 2003—2018. A total of 29 458 participants were enrolled, including 12 528 patients with MASLD and 16 930 non-MASLD controls. The control status of nine risk factors was assessed, i.e., hypertension, diabetes, liver fibrosis (assessed by fibrosis-4 index [FIB-4]), aspartate aminotransferase (AST)/alanine aminotransferase (ALT) ratio, serum albumin, renal function (assessed by serum creatinine), systemic inflammation (assessed by neutrophil count), smoking, and physical activity. According to the status of comprehensive risk factor control, the patients with MASLD were further divided into low-control group with 1 107 patients, moderate-control group with 7 042 patients, and high-control group with 4 379 patients. A total of 397 participants were enrolled in the external validation cohort, among whom there were 266 participants with MASLD and 131 participants without MASLD. The Kruskal-Wallis H test was used for comparison of continuous data between multiple groups, and the chi-square test was used for comparison of categorical data between groups. The Cox proportional hazards model incorporating complex sampling weights for NHANES data were used to investigate the association between the degree of risk factor control and all-cause mortality, and the Kaplan-Meier curve, the log-rank test, restricted mean survival time (RMST), and population attributable fraction (PAF) were used for further assessment. The robustness of the findings was validated in an independent clinical cohort (n=397). Results The cohort study based on the NHANES database showed that during the median follow-up time of 6.7 years, 1 171 deaths occurred among the 12 528 patients with MASLD. There was a significant reduction in mortality risk with the increase in the number of risk factors controlled (trend test: χ2 =65.06, P<0.001). Compared with the low-control group, the mortality risk decreased successively in the moderate-control group (hazard ratio [HR]=0.59, 95% confidence interval [CI]: 0.51 — 0.69) and the high-control group (HR=0.36, 95%CI: 0.27 — 0.48), and the mortality risk was reduced by 22% for each additional risk factor controlled (HR=0.78, 95%CI: 0.74 — 0.82). The PAF analysis showed that AST/ALT ratio control (PAF=19.2%) and physical activity (PAF=18.9%) were the largest contributors. The survival analysis of the sub-cohort constructed based on nearest neighbor matching (with a maximum follow-up time of 13.3 years) showed that there was a significant difference in cumulative survival rate between the MASLD groups with different control levels and the non-MASLD group (P<0.001). The RMST analysis further quantified the survival benefit of each group, and the high-control group had the longest 10-year RMST (9.88 years), which was superior to that of the non-MASLD group (9.43 years), the moderate-control group (9.33 years), and the low-control group (7.96 years). The multivariable-adjusted model analysis of the complete cohort showed that compared with the non-MASLD population, the MASLD patients in the low-control group had a significant increase in mortality risk, the moderate-control group had a comparable mortality risk, and the high-control group had a significantly lower mortality risk. The subgroup analysis showed a significant protective effect of comprehensive control in both male and female individuals (P<0.05), and the interaction analysis suggested a potentially stronger protective effect in female individuals (Pfor interaction=0.031). The protective effect was statistically significant in patients aged ≥60 years (P<0.05). There was a significant difference in protective effect across the groups stratified based on waist circumference (P<0.05), but there was no significant interaction between groups (Pfor interaction=0.821). In the external validation cohort, among the 397 participants, there were 72 cases of all-cause mortality (18.1%). The survival analysis showed a significant gradient increase in the survival rate of MASLD patients with the increase in the level of control (P=0.022). The RMST analysis showed that the moderate- and high-control groups had a better RMST than the non-MASLD group at 5 years (4.47 years vs 4.56 years vs 4.40 years), with a more significant survival advantage at 10 years (8.67 years vs 8.95 years vs 8.44 years). The Cox regression analysis showed that, with the low-control MASLD group as the reference, there was a significant reduction in mortality risk in the moderate-control group (HR=0.41, 95%CI: 0.21 — 0.81) and the high-control group (HR=0.32, 95%CI: 0.14 — 0.71); with the non-MASLD population as the reference, there was a significant increase in mortality risk in the low-control group (HR=2.02, 95%CI: 1.03 — 3.95), with a comparable mortality risk in the moderate-control group (HR=0.83, 95%CI: 0.48 — 1.44) and the high-control group (HR=0.66, 95%CI: 0.30 — 1.38), and the point estimates of the effects were highly consistent with the main study. Conclusion Among MASLD patients, better control of metabolic risk factors is associated with a lower mortality risk. Achieving optimal control can eliminate the excess mortality risk associated with MASLD, thereby helping patients achieve a better survival prognosis than the general population. -
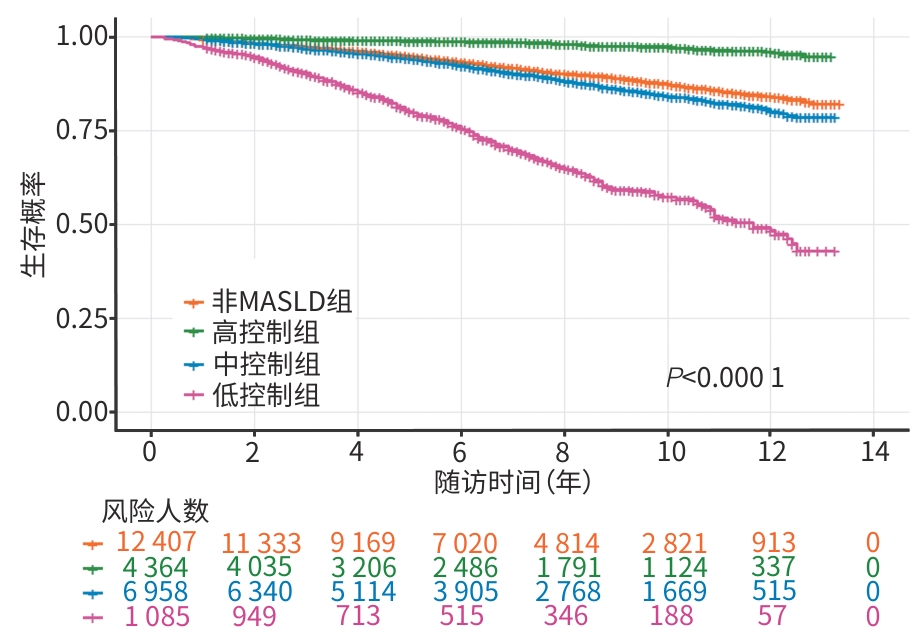
注: MASLD,代谢功能障碍相关脂肪性肝病。
图 1 不同危险因素控制水平的MASLD组与非MASLD组的累积生存率比较的Kaplan-Meier生存曲线
Figure 1. Kaplan-Meier survival curves: Comparison of cumulative survival rates among MASLD patients with different levels of risk factor control and non-MASLD controls
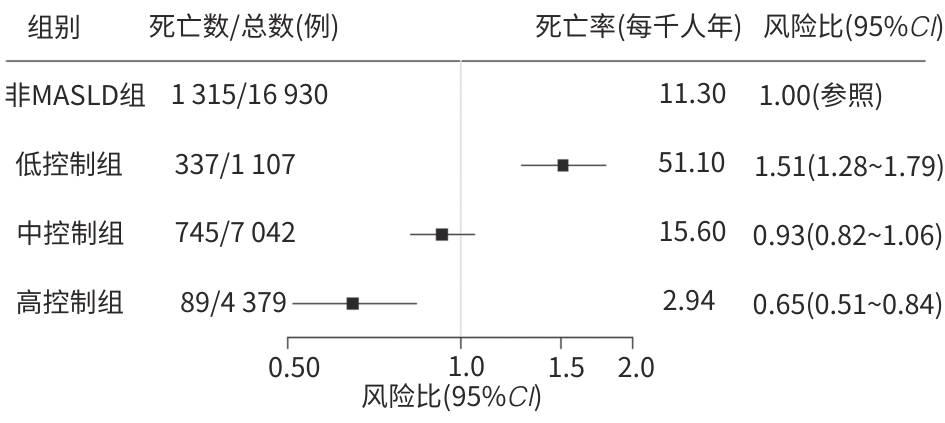
注: MASLD,代谢功能障碍相关脂肪性肝病;CI,置信区间。
图 2 以非MASLD组为参照的MASLD患者全因死亡风险的森林图
Figure 2. Forest plot: All-cause mortality risk in MASLD patients with the non-MASLD group as reference
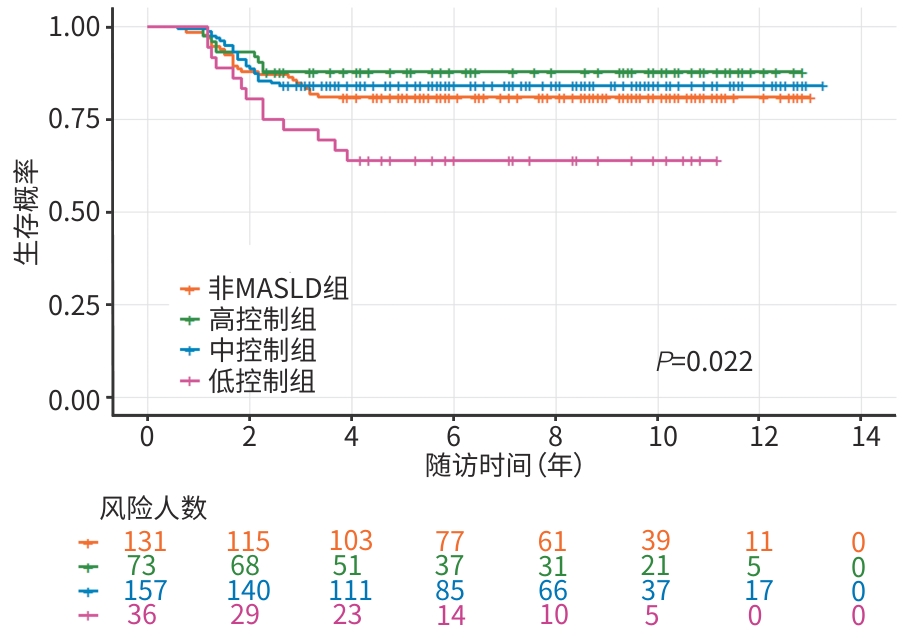
注: MASLD,代谢功能障碍相关脂肪性肝病。
图 3 外部验证队列的Kaplan-Meier生存曲线
Figure 3. Kaplan-Meier survival curves by metabolic control status in the external validation cohort
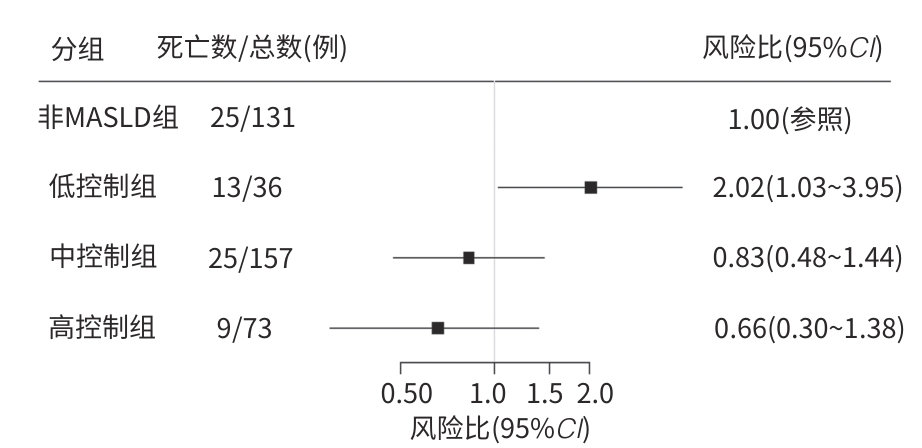
注: MASLD,代谢功能障碍相关脂肪性肝病;CI,置信区间。
图 4 外部验证队列中不同危险因素控制水平的MASLD患者全因死亡风险的森林图
Figure 4. Forest plot: All-cause mortality risk in the external validation cohort of MASLD patients by level of risk factor control
表 1 按危险因素控制程度分组的研究人群基线特征
Table 1. Baseline characteristics of study group according to the degree of risk factor control
变量 非MASLD组
(n=16 930)MASLD组(n=12 528) 统计值 P值1) 低控制组(n=1 107) 中控制组(n=7 042) 高控制组(n=4 379) 年龄(岁) 46(31~62) 68(61~76) 58(45~68) 40(31~51) H=3 136.537 <0.001 男[例(%)] 7 941(46.90) 606(54.74) 3 413(48.47) 2 409(55.01) χ2 =107.935 <0.001 白种人[例(%)] 7 062(41.71) 487(43.99) 3 038(43.14) 1 575(35.97) χ2=65.723 <0.001 婚姻状况[例(%)] χ2=126.628 <0.001 稳定 9 887(58.41) 624(56.37) 4 214(59.92) 2 956(67.50) 其他 7 039(41.59) 483(43.63) 2 819(40.08) 1 423(32.50) 教育水平[例(%)] χ2 =573.795 <0.001 高中以下 3 727(22.04) 408(36.89) 2 047(29.08) 964(22.03) 高中毕业或部分大学 8 578(50.72) 580(52.44) 3 893(55.31) 2 374(54.26) 大学毕业或以上 4 607(27.24) 118(10.67) 1 099(15.61) 1 037(23.70) 贫困收入比2)[例(%)] χ2 =153.965 <0.001 <5 12 403(80.40) 887(89.42) 5 526(86.59) 3 286(82.23) ≥5 3 024(19.6) 105(10.58) 856(13.41) 710(17.77) 体力活动水平[例(%)] χ2 =1 635.054 <0.001 活跃 7 485(44.21) 88(7.95) 1 896(26.92) 2 511(57.34) 不足 9 445(55.79) 1 019(92.05) 5 146(73.08) 1 868(42.66) 久坐时间(min/d) 300(180~480) 360(240~480) 360(180~480) 300(180~480) H=140.570 <0.001 当前饮酒者3)[例(%)] 9 918(74.50) 576(66.74) 3 826(68.49) 2 309(69.59) χ2 =102.122 <0.001 当前吸烟者[例(%)] 7 273(42.96) 863(77.96) 3 831(54.40) 1 007(23.00) χ2 =1 618.451 <0.001 高血压[例(%)] 4 548(26.86) 1 031(93.13) 4 216(59.87) 673(15.37) χ2 =4 756.721 <0.001 糖尿病[例(%)] 1 263(7.46) 779(70.37) 1 596(22.66) 131(2.99) χ2 =4 859.968 <0.001 体重指数(kg/m2) 25.1(22.6~27.8) 33.3(30.0~37.9) 33.0(29.8~37.3) 32.8(29.9~37.0) H=14 230.340 <0.001 腰围(cm) 89.9(82.2~96.9) 115.0(106.7~124.0) 110.6(103.5~119.7) 107.6(101.1~116.3) H=14 836.667 <0.001 FIB-4指数 0.96(0.64~1.47) 1.71(1.37~2.21) 1.16(0.79~1.60) 0.73(0.53~0.98) H=2 959.496 <0.001 AST/ALT比值 1.18(0.97~1.39) 1.16(1.00~1.39) 1.04(0.88~1.23) 0.84(0.69~1.05) H=3 772.959 <0.001 白蛋白(g/dL) 4.3(4.1~4.5) 4.1(3.8~4.3) 4.1(3.9~4.4) 4.2(4.0~4.5) H=1 198.073 <0.001 中性粒细胞(×109/L) 3.8(2.9~4.8) 4.4(3.2~6.1) 4.3(3.3~5.5) 4.3(3.5~5.2) H=829.382 <0.001 肌酐(mg/dL) 0.83(0.70~0.99) 1.20(0.92~1.42) 0.86(0.72~1.02) 0.82(0.71~0.95) H=1 034.613 <0.001 血小板(×109/L) 233(198~274) 208(174~252) 237(200~284) 255(220~296) H=693.386 <0.001 糖化血红蛋白(%) 5.4(5.2~5.7) 6.5(5.8~7.5) 5.8(5.5~6.3) 5.5(5.3~5.8) H=3 695.795 <0.001 甘油三酯(mg/dL) 97.0(68.0~141.0) 167.0(118.0~245.5) 164.0(113.0~237.0) 168.0(115.0~253.5) H=5 474.457 <0.001 γ-谷氨酰转移酶(U/L) 17(13~25) 25(18~43) 24(18~37) 27(19~40) H=3 390.048 <0.001 注:1)非MASLD组、低控制组、中控制组、高控制组4组间比较。2)贫困收入比=家庭总收入与联邦贫困线的比值[20],取值范围为0~5;非MASLD组缺失1 503例、低控制组缺失115例、中控制组缺失660例、高控制组缺失383例。3)非MASLD组缺失3 617例、低控制组缺失244例、中控制组缺失1 456例、高控制组缺失1 061例。MASLD,代谢功能障碍相关脂肪性肝病;FIB-4指数,肝纤维化-4指数;AST,天冬氨酸氨基转移酶;ALT,丙氨酸氨基转移酶。
 下载: 导出CSV
表 2 代谢功能障碍相关脂肪性肝病患者中联合危险因素控制程度与死亡风险的关联
Table 2. Associations between the degree of joint risk factor control and mortality risk among individuals with MASLD
危险因素控制 死亡数/总数(例) 死亡率(每千人年) HR(95%CI) PAF(%) 未调整模型 多变量调整模型1) 联合危险因素控制程度 低控制组 337/1 107 51.05 1.00 1.00 中控制组 745/7 042 15.65 0.31(0.27~0.36) 0.59(0.51~0.69) 高控制组 89/4 379 2.94 0.06(0.05~0.07) 0.36(0.27~0.48) 每多控制1个危险因素 0.56(0.54~0.59) 0.78(0.74~0.82) 具体危险因素控制 FIB-4指数2) 361/8 512 6.12 0.19(0.17~0.21) 0.76(0.63~0.92) 8.3 AST/ALT比值2) 120/2 930 6.19 0.39(0.32~0.47) 0.79(0.64~0.98) 19.2 白蛋白2) 1 117/12 170 13.52 0.46(0.35~0.61) 0.45(0.33~0.62) 1.6 肌酐2) 708/9 980 10.31 0.34(0.30~0.39) 0.74(0.65~0.84) 5.7 中性粒细胞2) 1 063/11 634 13.53 0.74(0.60~0.90) 0.63(0.50~0.79) 2.7 高血压2) 351/6 608 7.68 0.36(0.32~0.41) 0.77(0.67~0.88) 12.4 糖尿病2) 750/10 022 10.88 0.39(0.35~0.44) 0.77(0.66~0.91) 4.8 吸烟状况2) 444/6 827 9.65 0.51(0.46~0.58) 0.76(0.66~0.88) 12.2 体力活动2) 283/4 495 9.36 0.57(0.50~0.66) 0.75(0.65~0.87) 18.9 注:1)调整了年龄、性别、家庭收入水平、婚姻状况、教育水平、种族/民族、血小板计数、腰围、糖化血红蛋白、饮酒状况、久坐时间、甘油三酯、体重指数和γ-谷氨酰转移酶;2)表示与该风险因素未受控制的状态进行比较。FIB-4指数,纤维化-4指数;AST,天冬氨酸氨基转移酶;ALT,丙氨酸氨基转移酶;HR,风险比;CI,置信区间;PAF,人群归因分值。
下载: 导出CSV
表 3 代谢功能障碍相关脂肪性肝病患者联合危险因素控制程度与死亡风险关联的亚组分析
Table 3. Subgroup analysis of associations between the degree of joint risk factor control and mortality risk among individuals with MASLD
亚组 中控制组 vs 低控制组
[HR(95%CI)]P值 高控制组 vs 低控制组
[HR(95%CI)]P值 P交互 性别 0.031 女 0.59(0.46~0.75) <0.001 0.36(0.22~0.58) <0.001 男 0.67(0.55~0.81) <0.001 0.46(0.32~0.66) <0.001 年龄 0.575 ≥60岁 0.63(0.53~0.74) <0.001 0.35(0.23~0.52) <0.001 <60岁 0.77(0.48~1.23) 0.269 0.57(0.31~1.04) 0.067 腰围 0.821 升高(≥100 cm) 0.64(0.55~0.75) <0.001 0.44(0.32~0.60) <0.001 正常(<100 cm) 0.67(0.40~1.10) 0.112 0.38(0.17~0.83) 0.016 注:亚组分析均基于多变量调整Cox比例风险模型,调整了家庭收入水平、婚姻状况、教育水平、种族/民族、血小板计数、糖化血红蛋白、饮酒状况、久坐时间、甘油三酯、体重指数和γ-谷氨酰转移酶。HR,风险比;CI,置信区间。
下载: 导出CSV
表 4 外部验证队列按危险因素控制程度分组的基线特征
Table 4. Baseline characteristics of the external validation cohort according to the degree of risk factor control
变量 非MASLD组
(n=131)MASLD组(n=266) 统计值 P值1) 低控制组(n=36) 中控制组(n=157) 高控制组(n=73) 年龄(岁) 48(32~64) 70(56~75) 57(45~69) 41(33~51) H=63.153 <0.001 男[例(%)] 66(50.38) 18(50.00) 76(48.41) 35(47.95) χ2=0.167 0.983 体力活动水平[例(%)] χ²=39.735 <0.001 活跃 52(39.69) 2(5.46) 38(24.20) 42(57.53) 不足 79(60.31) 34(94.44) 119(75.80) 31(42.47) 当前吸烟者[例(%)] 63(48.09) 24(66.67) 79(50.32) 18(24.66) χ2=20.944 <0.001 当前饮酒者2)[例(%)] 79(72.4) 19(65.52) 90(73.77) 38(71.70) χ²=0.806 0.848 高血压[例(%)] 46(35.11) 35(97.22) 99(63.06) 10(13.70) χ²=92.350 <0.001 糖尿病[例(%)] 13(9.92) 27(75.00) 29(18.47) 2(2.74) χ²=102.531 <0.001 体重指数(kg/m2) 23.96(21.75~26.66) 35.62(29.73~38.85) 32.20(29.70~36.00) 34.21(31.71~39.00) H=205.108 <0.001 腰围(cm) 88.0(80.3~95.7) 118.0(108.4~126.2) 108.8(103.4~116.4) 110.0(105.1~117.3) H=191.221 <0.001 FIB-4指数 1.01(0.74~1.77) 1.62(1.41~2.14) 1.24(0.83~1.57) 0.77(0.53~0.91) H=70.135 <0.001 AST/ALT比值 1.24(1.00~1.46) 1.13(1.03~1.37) 1.10(0.92~1.30) 0.85(0.68~1.07) H=55.217 <0.001 白蛋白(g/dL) 4.2(4.0~4.4) 4.1(3.9~4.2) 4.2(4.0~4.4) 4.2(4.1~4.4) H=6.403 0.094 中性粒细胞计数(103/µL) 3.7(3.0~4.9) 4.7(3.3~6.4) 4.2(3.1~5.1) 4.4(3.6~5.1) H=10.328 0.016 肌酐(mg/dL) 0.85(0.72~1.01) 1.12(0.86~1.41) 0.90(0.77~1.04) 0.84(0.72~0.94) H=18.841 <0.001 血小板(×109/L) 220.0(188.5~260.0) 199.0(166.8~244.3) 235.0(202.0~294.0) 258.0(221.0~313.0) H=25.928 <0.001 糖化血红蛋白(%) 5.5(5.2~5.7) 6.6(5.8~7.1) 5.8(5.4~6.1) 5.5(5.3~5.8) H=52.335 <0.001 甘油三酯(mg/dL) 84.0(65.0~130.5) 193.0(131.3~227.5) 151.0(108.0~227.0) 154.0(103.0~240.0) H=76.175 <0.001 γ-谷氨酰转移酶(U/L) 16.0(12.0~25.5) 27.0(18.8~35.5) 23.0(18.0~35.0) 28.0(19.0~52.0) H=49.836 <0.001 注:1)非MASLD组、低控制组、中控制组、高控制组4组间比较;2)非MASLD组缺失22例、低控制组缺失7例、中控制组缺失35例、高控制组缺失20例。MASLD,代谢功能障碍相关脂肪性肝病;FIB-4指数,纤维化-4指数;AST,天冬氨酸氨基转移酶;ALT,丙氨酸氨基转移酶。
下载: 导出CSV
-
[1] Rinella M E, Lazarus J V, Ratziu V, et al. A multisociety Delphi consensus statement on new fatty liver disease nomenclature[J]. Hepatology, 2023, 78( 6): 1966- 1986. DOI: 10.1097/HEP.0000000000000520. [2] Kaylan K B, Paul S. NAFLD No more: A review of current guidelines in the diagnosis and evaluation of metabolic dysfunction-associated steatotic liver disease(MASLD)[J]. Curr Diab Rep, 2024, 25( 1): 5. DOI: 10.1007/s11892-024-01558-y. [3] Riazi K, Azhari H, Charette J H, et al. The prevalence and incidence of NAFLD worldwide: A systematic review and meta-analysis[J]. Lancet Gastroenterol Hepatol, 2022, 7( 9): 851- 861. DOI: 10.1016/S2468-1253(22)00165-0. [4] Ekstedt M, Hagström H, Nasr P, et al. Fibrosis stage is the strongest predictor for disease-specific mortality in NAFLD after up to 33 years of follow-up[J]. Hepatology, 2015, 61( 5): 1547- 1554. DOI: 10.1002/hep.27368. [5] Le M H, Devaki P, Ha N B, et al. Prevalence of non-alcoholic fatty liver disease and risk factors for advanced fibrosis and mortality in the United States[J]. PLoS One, 2017, 12( 3): e0173499. DOI: 10.1371/journal.pone.0173499. [6] Wang T T, Xi Y Z, Raji A, et al. Overall and subgroup prevalence of non-alcoholic fatty liver disease and prevalence of advanced fibrosis in the United States: An updated national estimate in National Health and Nutrition Examination Survey(NHANES) 2011-2018[J]. Ann Hepatol, 2024, 29( 1): 101154. DOI: 10.1016/j.aohep.2023.101154. [7] Chinese Society of Hepatology, Chinese Medical Association. Guidelines for the prevention and treatment of metabolic dysfunction-associated(non-alcoholic) fatty liver disease(version 2024)[J]. J Prac Hepatol, 2024, 27( 4): 494- 510. DOI: 10.3760/cma.j.cn501113-20240327-00163.中华医学会肝病学分会. 代谢相关(非酒精性)脂肪性肝病防治指南(2024年版)[J]. 实用肝脏病杂志, 2024, 27( 4): 494- 510. DOI: 10.3760/cma.j.cn501113-20240327-00163. [8] Bedogni G, Bellentani S, Miglioli L, et al. The Fatty Liver Index: A simple and accurate predictor of hepatic steatosis in the general population[J]. BMC Gastroenterol, 2006, 6: 33. DOI: 10.1186/1471-230X-6-33. [9] Musso G, Gambino R, Cassader M, et al. Meta-analysis: Natural history of non-alcoholic fatty liver disease(NAFLD) and diagnostic accuracy of non-invasive tests for liver disease severity[J]. Ann Med, 2011, 43( 8): 617- 649. DOI: 10.3109/07853890.2010.518623. [10] Aneni E C, Oni E T, Martin S S, et al. Blood pressure is associated with the presence and severity of nonalcoholic fatty liver disease across the spectrum of cardiometabolic risk[J]. J Hypertens, 2015, 33( 6): 1207- 1214. DOI: 10.1097/HJH.0000000000000532. [11] Ciardullo S, Monti T, Sala I, et al. Nonalcoholic fatty liver disease and advanced fibrosis in US adults across blood pressure categories[J]. Hypertension, 2020, 76( 2): 562- 568. DOI: 10.1161/HYPERTENSIONAHA.120.15220. [12] National Center for Health Statistics. Biochemistry profile-creatinine( 2019-2020)[R/OL]. National Health and Nutrition Examination Survey, 2019. https://wwwn.cdc.gov/nchs/data/nhanes/public/2019/labmethods/BIOPRO-K-MET-Creatinine-508.pdf. https://wwwn.cdc.gov/nchs/data/nhanes/public/2019/labmethods/BIOPRO-K-MET-Creatinine-508.pdf [13] Mohammadi M, Aminian K, Joukar F, et al. Diagnostic value of serologic biomarkers for the detection of liver fibrosis in non-alcoholic fatty liver disease[J]. Caspian J Intern Med, 2025, 16( 2): 275- 283. DOI: 10.22088/cjim.16.2.275. [14] Rinella M E, Neuschwander-tetri B A, Siddiqui M S, et al. AASLD practice guidance on the clinical assessment and management of nonalcoholic fatty liver disease[J]. Hepatology, 2023, 77( 5): 1797- 1835. DOI: 10.1097/HEP.0000000000000323. [15] National Center for Health Statistics. Complete blood count-whole blood( 2017-2018)[R/OL]. National Health and Nutrition Examination Survey, 2019. https://wwwn.cdc.gov/nchs/data/nhanes/public/2017/labmethods/CBC-J-MET-508.pdf. https://wwwn.cdc.gov/nchs/data/nhanes/public/2017/labmethods/CBC-J-MET-508.pdf [16] Tahir N, Zahra F. Neutrophilia[EB/OL]. Treasure Island(FL): StatPearls Publishing, 2023. https://www.ncbi.nlm.nih.gov/books/NBK570571/. https://www.ncbi.nlm.nih.gov/books/NBK570571/ [17] World Health Organization. Global recommendations on physical activity for health[R]. Geneva: World Health Organization, 2010. [18] Akinbami L J, Chen T C, Davy O, et al. National health and nutrition examination survey, 2017-March 2020 prepandemic file: Sample design, estimation, and analytic guidelines[J]. Vital Health Stat 1, 2022( 190): 1- 36. [19] Nguyen V K, Middleton L Y M, Huang L, et al. Harmonized US National Health and Nutrition Examination Survey 1988—2018 for high throughput exposome-health discovery[J]. Environ Int, 2023, 181: 108259. DOI: 10.1016/j.envint.2023.108259. [20] National Center for Health Statistics. Demographic variables and sample weights( 2015-2016)[R/OL]. National Health and Nutrition Examination Survey, 2017. https://wwwn.cdc.gov/nchs/nhanes/Search/DataPage.aspx?Component=Demographics&CycleBeginYear=2015. https://wwwn.cdc.gov/nchs/nhanes/Search/DataPage.aspx?Component=Demographics&CycleBeginYear=2015 [21] Hakeem A, Van berlo J, Revelo X S. The cardiohepatic axis in metabolic disease liver to heart[J]. JACC Basic Transl Sci, 2025, 10( 7): 101309. DOI: 10.1016/j.jacbts.2025.05.004. [22] Han E, Woo S Y, Jeon J Y, et al. Impact of physical activities in metabolic dysfunction associated steatotic liver disease, sarcopenia, and cardiovascular disease[J]. Diabetes Res Clin Pract, 2025, 224: 112209. DOI: 10.1016/j.diabres.2025.112209. [23] Song Q R, Liu S L, Ling Q H, et al. Severity of nonalcoholic fatty liver disease is associated with cardiovascular outcomes in patients with prehypertension or hypertension: A community-based cohort study[J]. Front Endocrinol, 2022, 13: 942647. DOI: 10.3389/fendo.2022.942647. [24] Han Y, Tang J, Wu N, et al. Association between the Life’s essential 8 health behaviors score and all-cause mortality in patients with metabolic dysfunction-associated steatotic liver disease[J]. Metabolism, 2025, 163: 156096. DOI: 10.1016/j.metabol.2024.156096. [25] Cho Y K, Kim M J, Kim E H, et al. Comparison of diagnostic criteria for fatty liver disease in assessing cardiac dysfunction: A cross-sectional study[J]. Hepatol Int, 2026, 20( 1): 81- 90. DOI: 10.1007/s12072-025-10924-1. [26] Celsa C, Pennisi G, Tulone A, et al. Risk of hepatic and extrahepatic outcomes associated with metabolic dysfunction-associated steatotic liver disease and metabolic dysfunction and alcohol-associated steatotic liver disease: A systematic review and meta-analysis[J]. Lancet Gastroenterol Hepatol, 2025, 10( 11): 998- 1012. DOI: 10.1016/S2468-1253(25)00188-8. [27] Younossi Z M, Koenig A B, Abdelatif D, et al. Global epidemiology of nonalcoholic fatty liver disease-Meta-analytic assessment of prevalence, incidence, and outcomes[J]. Hepatology, 2016, 64( 1): 73- 84. DOI: 10.1002/hep.28431. [28] Sakai K, Shima T, Oya H, et al. Association between liver fibrosis and cause-specific mortality in Japanese patients with biopsy-confirmed metabolic dysfunction-associated steatotic liver disease: A prospective cohort study/liver fibrosis and mortality in Japanese MASLD[J]. Hepatol Res, 2026, 56( 1): 33- 49. DOI: 10.1111/hepr.70034. [29] Angulo P, Kleiner D E, Dam-larsen S, et al. Liver fibrosis, but no other histologic features, is associated with long-term outcomes of patients with nonalcoholic fatty liver disease[J]. Gastroenterology, 2015, 149( 2): 389- 397.e10. DOI: 10.1053/j.gastro.2015.04.043. [30] Liu Zhengyi, Zhuang Yingjie, Dong Xu, et al. Construction of a non-invasive diagnostic model for liver fibrosis in metabolic dysfunction-associated steatotic liver disease(MASLD)[J]. Clin J Med Offic, 2024, 52( 7): 688- 691. DOI: 10.16680/j.1671-3826.2024.07.07.刘正一, 庄颖洁, 董旭, 等. 非酒精性脂肪性肝病肝纤维化无创诊断模型构建[J]. 临床军医杂志, 2024, 52( 7): 688- 691. DOI: 10.16680/j.1671-3826.2024.07.07. [31] Machado M V, Cortez-pinto H. Non-invasive diagnosis of non-alcoholic fatty liver disease. A critical appraisal[J]. J Hepatol, 2013, 58( 5): 1007- 1019. DOI: 10.1016/j.jhep.2012.11.021. [32] Vilar-gomez E, Chalasani N. Non-invasive assessment of non-alcoholic fatty liver disease: Clinical prediction rules and blood-based biomarkers[J]. J Hepatol, 2018, 68( 2): 305- 315. DOI: 10.1016/j.jhep.2017.11.013. -

 本文二维码
本文二维码
计量
- 文章访问数: 515
- HTML全文浏览量: 104
- PDF下载量: 55
- 被引次数: 0