PDF下载 ( 2288 KB)

体圆指数对代谢相关脂肪性肝病发生风险的预测价值
DOI: 10.12449/JCH251015
Value of body roundness index in predicting the risk of metabolic dysfunction-associated fatty liver disease
-
摘要:
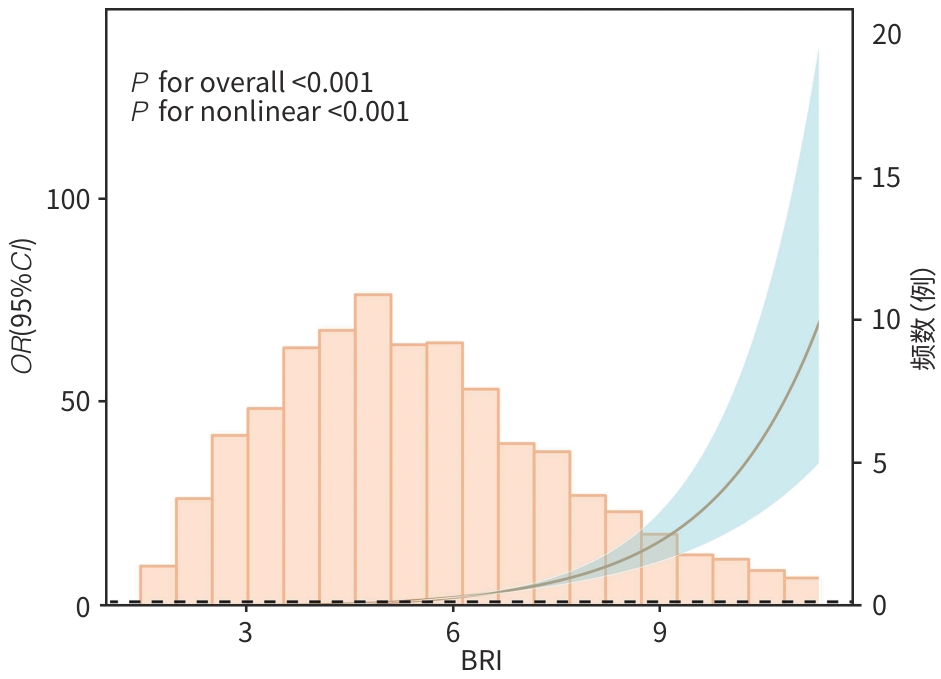
目的 基于美国国家健康与营养调查(NHANES)数据库,系统评估体圆指数(BRI)与代谢相关脂肪性肝病(MAFLD)风险的关联性,并探讨BRI作为非侵入性风险预测工具的临床应用价值。 方法 利用2015—2020年NHANES数据,将纳入人群(n=4 573)分为 MAFLD组(n=2 508)和non-MAFLD组(n=2 065),计算各参与者的BRI。为确保数据质量并减少异常值对分析结果的干扰,本研究采用箱线图方法对BRI进行异常值剔除,从而提高数据的稳健性。计量资料两组间比较采用Wilcoxon秩和检验;计数资料两组间比较采用χ2检验。为探讨BRI与MAFLD之间的关系,构建多重调整的Logistic回归模型。将BRI根据四分位数分为4组,以第1个四分位数(Q1)为参考并计算3个模型中的比值比(OR)和95%可信区间(95%CI)。应用限制性立方样条分析探讨BRI与MAFLD之间的效应剂量关系。为评估BRI对MAFLD的诊断效能,绘制受试者操作特征曲线(ROC曲线),并计算曲线下面积(AUC)。采用决策曲线分析评估模型在实际应用中的潜在临床价值。通过交互作用分析和亚组分析,探讨不同人群中BRI与MAFLD关联的差异。采用Lasso回归进行特征变量筛选与分析。 结果 与non-MAFLD组相比,MAFLD组受试者的BRI显著升高(Z=36.29,P<0.001)。在完全校正Logistic回归模型(调整年龄、性别、种族、受教育程度、贫困收入比、婚姻状况、吸烟状况、高血压、糖尿病、ALT、AST、GGT及高密度脂蛋白胆固醇等变量)中,BRI与MAFLD患病风险呈显著正相关(OR=2.53,95%CI:2.28~2.80,P<0.001)。此外,BRI最高四分位数(Q4)组MAFLD风险明显高于Q1组(OR=83.45,95%CI:51.87~134.26,P<0.001)。限制性立方样条分析进一步确认了BRI与MAFLD之间存在显著的非线性关系(P for nonlinear<0.001)。交互作用与亚组分析显示,高血压与BRI之间的交互作用具有统计学意义(P交互=0.003);与无高血压者相比,在高血压人群中,BRI与MAFLD的关联性更强(OR=1.60,95%CI:1.23~2.08,P<0.001)。ROC曲线分析显示,以BRI为核心构建的完全校正模型在区分MAFLD与非MAFLD方面具有较高判别力,AUC为0.887(95%CI:0.877~0.896)。决策曲线分析显示,在临床常用的风险阈值0.10~0.75范围内,完全校正模型具有较好的净获益。Lasso回归筛选关键变量后建立的模型AUC为0.882(95%CI:0.872~0.892),验证了预测结果的稳定性。 结论 BRI与MAFLD风险存在显著的正向关联,且在高血压人群中相关性更强。BRI作为反映腹型肥胖和内脏脂肪积聚的体型指标,在MAFLD的风险评估中具有良好的应用前景。 Abstract:Objective To investigate the association between body roundness index (BRI) and the risk of metabolic dysfunction-associated fatty liver disease (MAFLD) based on the National Health and Nutrition Examination Survey (NHANES) database, as well as the clinical value of BRI as a noninvasive tool for risk prediction. Methods Based on the NHANES data in 2015—2020, the 4 573 individuals were divided into MAFLD group with 2 508 individuals and non-MAFLD group with 2 065 individuals, and BRI was calculated for each individual. In order to ensure data quality and reduce the impact of abnormal values on analytical results, the boxplot method was used to remove abnormal levels of BRI and improve the robustness of data. The Wilcoxon rank-sum test was used for comparison of continuous data between two groups, and the chi-square test was used for comparison of categorical data between two groups. The multivariate Logistic regression model was established to investigate the association between BRI and MAFLD. BRI was divided into four groups based on quantiles, and with the first quantile (Q1) as reference, odds ratio (OR) and 95% confidence interval (CI) were calculated for the other three models. Restricted cubic spline was used to investigate the dose-effect relationship between BRI and MAFLD. The receiver operating characteristic (ROC) curve was plotted and the area under the ROC curve (AUC) was calculated to assess the efficacy of BRI in the diagnosis of MAFLD. The decision curve analysis was used to investigate the potential clinical value of the model in clinical practice. The interaction analysis and the subgroup analysis were performed to investigate the difference in the association between BRI and MAFLD between different populations. The Lasso regression analysis was conducted for the screening and analysis of characteristic variables. Results Compared with the non-MAFLD group, the MAFLD group had a significantly higher BRI (Z=36.29, P<0.001). After adjustment for the variables including age, sex, ethnicity, educational level, the proportion of individuals with poor income, marital status, smoking, hypertension, diabetes, alanine aminotransferase, aspartate aminotransferase, gamma-glutamyl transpeptidase, and high-density lipoprotein cholesterol, the fully adjusted Logistic regression model showed that BRI was significantly positively associated with the risk of MAFLD (OR=2.53, 95%CI: 2.28 — 2.80, P<0.001). In addition, the highest BRI quartile (Q4) group had a significantly higher risk of MAFLD than the lowest quartile (Q1) group (OR=83.45, 95%CI: 51.87 — 134.26, P<0.001). The restricted cubic spline analysis further confirmed the significant nonlinear association between BRI and MAFLD (P for nonlinear<0.001). The interaction analysis and the subgroup analysis showed that the interaction between hypertension and BRI had statistical significance (P for interaction=0.003), and compared with the individuals without hypertension, the individuals with hypertension had a stronger association between BRI and MAFLD (OR=1.60, 95%CI: 1.23 — 2.08, P<0.001). The ROC curve analysis showed that the fully adjusted model based on BRI had a strong discriminatory ability in differentiating MAFLD from non-MAFLD, with an AUC of 0.887 (95%CI: 0.877 — 0.896). The decision curve analysis showed that the fully adjusted model had good net benefits within the risk threshold of 0.10 — 0.75, which was commonly used in clinical practice. The model based on the key variables identified by the Lasso regression analysis had an AUC of 0.882 (95%CI: 0.872 — 0.892), which confirmed the robustness of the prediction results. Conclusion There is a significant positive correlation between BRI and the risk of MAFLD, with a stronger association observed in the hypertensive population. As a body index reflecting abdominal obesity and visceral fat accumulation, BRI shows promising application prospects in the risk assessment of MAFLD. -

注: a,ROC曲线;b,决策曲线。
图 2 BRI预测MAFLD的ROC曲线与决策曲线分析
Figure 2. ROC curve and decision curve analysis for BRI in predicting MAFLD
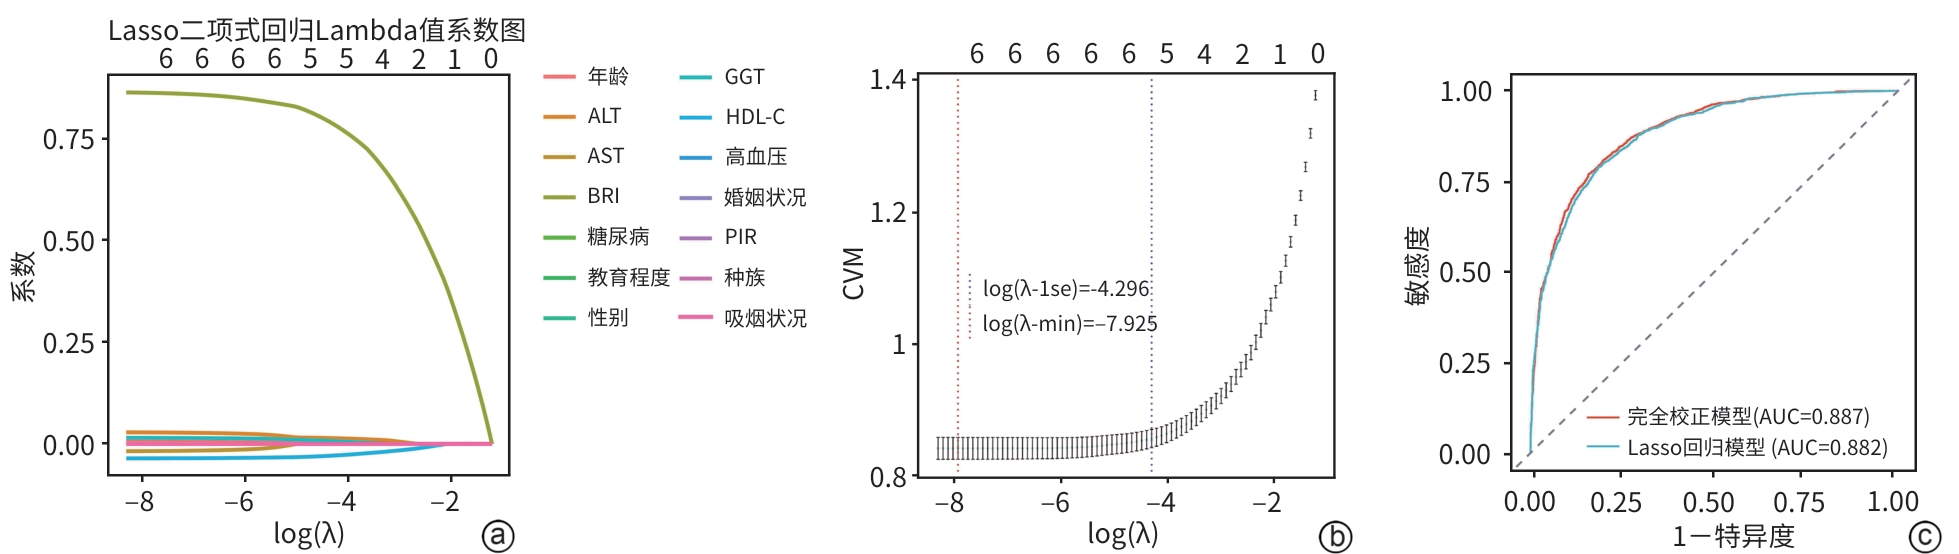
注: a,Lasso回归模型中各变量系数随λ值变化的路径图;b,Lasso回归模型的交叉验证损失均值随λ值变化的折线图,红色虚线为最优λ;c,Lasso回归模型与完全校正模型预测MAFLD的ROC曲线比较。
图 3 Lasso回归分析与完全校正模型预测性能比较
Figure 3. Comparison of predictive performance between Lasso regression and the fully adjusted model
表 1 研究队列的基线特征
Table 1. Baseline characteristics of the study cohort
变量 总计(n=4 573) non-MAFLD组(n=2 065) MAFLD组(n=2 508) 统计值 P值 年龄(岁) 50.00(35.00~63.00) 45.00(31.00~62.00) 54.00(40.00~64.00) Z=8.23 <0.001 性别[例(%)] χ2=21.82 <0.001 男 2 300(50.30) 960(46.49) 1 340(53.43) 女 2 273(49.70) 1 105(53.51) 1 168(46.57) 种族[例(%)] χ2=34.95 <0.001 墨西哥裔美国人 634(13.86) 233(11.28) 401(15.99) 非西班牙裔白人 1 646(35.99) 708(34.29) 938(37.40) 非西班牙裔黑人 1 015(22.20) 498(24.12) 517(20.61) 其他种族 1 278(27.95) 626(30.31) 652(26.00) 教育程度[例(%)] χ2=16.06 <0.001 高中以下学历 857(18.74) 360(17.43) 497(19.82) 高中或同等学历 1 055(23.07) 437(21.16) 618(24.64) 高中以上学历 2 661(58.19) 1 268(61.40) 1 393(55.54) 婚姻状况[例(%)] χ2=53.60 <0.001 已婚/与伴侣同居 2 782(60.84) 1 195(57.87) 1 587(63.28) 离婚/分居/丧偶 980(21.43) 410(19.85) 570(22.73) 从未结婚 811(17.73) 460(22.28) 351(14.00) PIR[例(%)] χ2=4.58 0.101 <1.3 1 267(27.71) 581(28.14) 686(27.35) 1.3~3.5 1 834(40.10) 794(38.45) 1 040(41.47) >3.5 1 472(32.19) 690(33.41) 782(31.18) BMI(kg/m2) 28.30(24.50~32.80) 24.70(22.20~27.70) 31.60(28.25~35.80) Z=37.31 <0.001 WC(cm) 98.50(88.50~109.70) 88.80(80.80~96.20) 107.20(98.90~116.70) Z=40.39 <0.001 BRI 5.21(3.94~6.77) 3.99(3.06~5.00) 6.35(5.17~7.85) Z=36.29 <0.001 ALT(U/L) 19.00(14.00~27.00) 17.00(13.00~23.00) 22.00(16.00~32.00) Z=13.43 <0.001 AST(U/L) 21.00(17.00~26.00) 20.00(17.00~25.00) 21.00(17.00~27.00) Z=3.93 <0.001 GGT(U/L) 20.00(15.00~31.00) 17.00(12.00~24.00) 24.00(17.00~38.00) Z=18.80 <0.001 HDL-C(mg/dL) 52.00(42.00~63.00) 58.00(48.00~70.00) 47.00(40.00~57.00) Z=-17.72 <0.001 高血压[例(%)] χ2=238.33 <0.001 否 2 266(49.55) 1 283(62.13) 983(39.19) 是 2 307(50.45) 782(37.87) 1 525(60.81) 糖尿病[例(%)] χ2=250.65 <0.001 否 3 628(79.34) 1 854(89.78) 1 774(70.73) 是 945(20.66) 211(10.22) 734(29.27) 吸烟状况[例(%)] χ2=42.69 <0.001 从未吸烟 2 556(55.89) 1 215(58.84) 1 341(53.47) 既往吸烟 1 130(24.71) 416(20.15) 714(28.47) 当前吸烟 887(19.40) 434(21.02) 453(18.06)  下载: 导出CSV
表 2 BRI与MAFLD的Logistic回归分析
Table 2. Logistic regression analysis of BRI and MAFLD
变量 模型1 模型2 模型3 OR(95%CI) P值 OR(95%CI) P值 OR(95%CI) P值 BRI 2.66(2.44~2.91) <0.001 2.90(2.63~3.20) <0.001 2.53(2.28~2.80) <0.001 BRI分类 Q1 1.00 1.00 1.00 Q2 6.52(4.77~8.92) <0.001 6.36(4.61~8.77) <0.001 4.47(3.20~6.26) <0.001 Q3 20.39(14.78~28.12) <0.001 22.73(16.08~32.14) <0.001 13.43(9.27~19.46) <0.001 Q4 105.22(68.81~160.90) <0.001 159.89(101.24~252.50) <0.001 83.45(51.87~134.26) <0.001 注:模型1中未调整变量;模型2中调整年龄、性别、种族、教育程度、PIR、婚姻状况等人口学变量;模型3为完全校正模型,在模型2的基础上进一步调整了吸烟状况、高血压、糖尿病、HDL-C、ALT、AST及GGT等变量。
下载: 导出CSV
表 3 BRI与MAFLD风险交互作用和亚组分析
Table 3. Subgroup and interaction analysis of BRI and MAFLD
变量 例数 OR(95%CI) P交互 年龄 0.506 >59岁 1 539 1.00 18~44岁 1 835 0.73(0.54~0.98) 45~59岁 1 199 1.40(1.01~1.95) 性别 0.320 女 2 273 1.00 男 2 300 1.81(1.37~2.39) 种族 0.140 墨西哥裔美国人 634 1.00 非西班牙裔黑人 1 015 0.71(0.50~1.00) 非西班牙裔白人 1 646 1.19(0.89~1.59) 其他种族 1 278 1.01(0.73~1.40) 教育程度 0.580 高中以上学历 2 661 1.00 高中以下学历 857 0.83(0.60~1.14) 高中或同等学历 1 055 1.14(0.85~1.54) PIR 0.126 <1.3 1 267 1.00 >3.5 1 472 1.56(1.13~2.15) 1.3~3.5 1 834 1.20(0.88~1.63) 婚姻状况 0.195 已婚/与伴侣同居 2 782 1.00 离婚/分居/丧偶 980 0.65(0.48~0.89) 从未结婚 811 0.48(0.36~0.66) 高血压 0.003 否 2 266 1.00 是 2 307 1.60(1.23~2.08) 糖尿病 0.222 否 3 628 1.00 是 945 1.34(0.94~1.90) 吸烟状况 0.066 当前吸烟 887 1.00 从未吸烟 2 556 1.00(0.71~1.40) 既往吸烟 1 130 1.29(0.87~1.90)
下载: 导出CSV
-
[1] ESLAM M, NEWSOME PN, SARIN SK, et al. A new definition for metabolic dysfunction-associated fatty liver disease: An international expert consensus statement[J]. J Hepatol, 2020, 73( 1): 202- 209. DOI: 10.1016/j.jhep.2020.03.039. [2] GOFTON C, UPENDRAN Y, ZHENG MH, et al. MAFLD: How is it different from NAFLD[J]. Clin Mol Hepatol, 2023, 29( Suppl): S17- S31. DOI: 10.3350/cmh.2022.0367. [3] WANG YK, WEI SY, LIU C, et al. A new definition of fatty liver disease: from nonalcoholic fatty liver disease to metabolic associated fatty liver disease[J]. Chin J Dig Surg, 2023, 22( S1): 117- 121. DOI: 10.3760/cma.j.cn115610-20230909-00080.王永康, 魏诗雨, 刘昌, 等. 脂肪性肝病新定义:从非酒精性脂肪性肝病到代谢功能障碍相关脂肪性肝病[J]. 中华消化外科杂志, 2023, 22( S1): 117- 121. DOI: 10.3760/cma.j.cn115610-20230909-00080. [4] LIM GEH, TANG A, NG CH, et al. An observational data meta-analysis on the differences in prevalence and risk factors between MAFLD vs NAFLD[J]. Clin Gastroenterol Hepatol, 2023, 21( 3): 619- 629. DOI: 10.1016/j.cgh.2021.11.038. [5] BAE SDW, GEORGE J, QIAO L. From MAFLD to hepatocellular carcinoma and everything in between[J]. Chin Med J(Engl), 2022, 135( 5): 547- 556. DOI: 10.1097/CM9.0000000000002089. [6] CHENG YM, KAO JH, WANG CC. The metabolic profiles and body composition of lean metabolic associated fatty liver disease[J]. Hepatol Int, 2021, 15( 2): 405- 412. DOI: 10.1007/s12072-021-10147-0. [7] HAGSTRÖM H, NASR P, EKSTEDT M, et al. Risk for development of severe liver disease in lean patients with nonalcoholic fatty liver disease: A long-term follow-up study[J]. Hepatol Commun, 2017, 2( 1): 48- 57. DOI: 10.1002/hep4.1124. [8] LEE SW, SON JY, KIM JM, et al. Body fat distribution is more predictive of all-cause mortality than overall adiposity[J]. Diabetes Obes Metab, 2018, 20( 1): 141- 147. DOI: 10.1111/dom.13050. [9] THOMAS DM, BREDLAU C, BOSY-WESTPHAL A, et al. Relationships between body roundness with body fat and visceral adipose tissue emerging from a new geometrical model[J]. Obesity(Silver Spring), 2013, 21( 11): 2264- 2271. DOI: 10.1002/oby.20408. [10] CAI XT, SONG SW, HU JL, et al. Body roundness index improves the predictive value of cardiovascular disease risk in hypertensive patients with obstructive sleep apnea: A cohort study[J]. Clin Exp Hypertens, 2023, 45( 1): 2259132. DOI: 10.1080/10641963.2023.2259132. [11] ZHANG Y, GAO WX, REN R, et al. Body roundness index is related to the low estimated glomerular filtration rate in Chinese population: A cross-sectional study[J]. Front Endocrinol(Lausanne), 2023, 14: 1148662. DOI: 10.3389/fendo.2023.1148662. [12] GAO WX, JIN LJ, LI DC, et al. The association between the body roundness index and the risk of colorectal cancer: A cross-sectional study[J]. Lipids Health Dis, 2023, 22( 1): 53. DOI: 10.1186/s12944-023-01814-2. [13] CHUNG TH, KIM JK, KIM JH, et al. Fatty liver index as a simple and useful predictor for 10-year cardiovascular disease risks determined by Framingham risk score in the general Korean population[J]. J Gastrointestin Liver Dis, 2021, 30( 2): 221- 226. DOI: 10.15403/jgld-3404. [14] HUANG ZM, NG K, CHEN HY, et al. Validation of controlled attenuation parameter measured by FibroScan as a novel surrogate marker for the evaluation of metabolic derangement[J]. Front Endocrinol(Lausanne), 2022, 12: 739875. DOI: 10.3389/fendo.2021.739875. [15] STEBBINS RC, NOPPERT GA, AIELLO AE, et al. Persistent socioeconomic and racial and ethnic disparities in pathogen burden in the United States, 1999-2014[J]. Epidemiol Infect, 2019, 147: e301. DOI: 10.1017/S0950268819001894. [16] LIU CF, CHIEN LW. Predictive role of neutrophil-percentage-to-albumin ratio(NPAR) in nonalcoholic fatty liver disease and advanced liver fibrosis in nondiabetic US adults: Evidence from NHANES 2017-2018[J]. Nutrients, 2023, 15( 8): 1892. DOI: 10.3390/nu15081892. [17] MU BS, LIU X, ZHU WY. Application of processing abnormal values in deformation monitoring based on N-standard-deviation method and boxplot method[J]. J Nantong Vocat Univ, 2023, 37( 2): 100- 104. DOI: 10.3969/j.issn.1008-5327.2023.02.022.穆宝胜, 刘欣, 朱文艳. 基于n个标准差法和箱线图法识别变形监测中异常值的应用探究[J]. 南通职业大学学报, 2023, 37( 2): 100- 104. DOI: 10.3969/j.issn.1008-5327.2023.02.022. [18] LI HJ, ZHANG Y, LUO HC, et al. The lipid accumulation product is a powerful tool to diagnose metabolic dysfunction-associated fatty liver disease in the United States adults[J]. Front Endocrinol(Lausanne), 2022, 13: 977625. DOI: 10.3389/fendo.2022.977625. [19] JIANG NN, ZHANG SG, CHU JG, et al. Association between body roundness index and non-alcoholic fatty liver disease detected by Fibroscan in America[J]. J Clin Lab Anal, 2023, 37( 19-20): e24973. DOI: 10.1002/jcla.24973. [20] ZHAO EF, WEN XL, QIU WQ, et al. Association between body roundness index and risk of ultrasound-defined non-alcoholic fatty liver disease[J]. Heliyon, 2023, 10( 1): e23429. DOI: 10.1016/j.heliyon.2023.e23429. [21] MANSOUR A, POURHASSAN S, GERAMI H, et al. Regional fat distribution and hepatic fibrosis and steatosis severity in patients with nonalcoholic fatty liver disease and type 2 diabetes[J]. Obes Sci Pract, 2024, 10( 4): e777. DOI: 10.1002/osp4.777. [22] TIAN XY, DING N, SU YJ, et al. Comparison of obesity-related indicators for nonalcoholic fatty liver disease diagnosed by transient elastography[J]. Turk J Gastroenterol, 2023, 34( 10): 1078- 1087. DOI: 10.5152/tjg.2023.23101. [23] XIE FF, PEI YY, ZHOU Q, et al. Comparison of obesity-related indices for identifying nonalcoholic fatty liver disease: A population-based cross-sectional study in China[J]. Lipids Health Dis, 2021, 20( 1): 132. DOI: 10.1186/s12944-021-01560-3. [24] KHANMOHAMMADI S, FALLAHTAFTI P, HABIBZADEH A, et al. Effectiveness of body roundness index for the prediction of nonalcoholic fatty liver disease: A systematic review and meta-analysis[J]. Lipids Health Dis, 2025, 24( 1): 117. DOI: 10.1186/s12944-025-02544-3. [25] LIU JR, FAN DM, WANG X, et al. Association of two novel adiposity indicators with visceral fat area in type 2 diabetic patients: Novel adiposity indexes for type 2 diabetes[J]. Medicine(Baltimore), 2020, 99( 19): e20046. DOI: 10.1097/MD.0000000000020046. [26] ELGUEZABAL RODELO RG, PORCHIA LM, TORRES-RASGADO E, et al. Visceral and subcutaneous abdominal fat is associated with non-alcoholic fatty liver disease while augmenting Metabolic Syndrome’s effect on non-alcoholic fatty liver disease: A cross-sectional study of NHANES 2017-2018[J]. PLoS One, 2024, 19( 2): e0298662. DOI: 10.1371/journal.pone.0298662. [27] EMAMAT H, JAMSHIDI A, FARHADI A, et al. The association between the visceral to subcutaneous abdominal fat ratio and the risk of cardiovascular diseases: A systematic review[J]. BMC Public Health, 2024, 24( 1): 1827. DOI: 10.1186/s12889-024-19358-0. [28] KAHN D, MACIAS E, ZARINI S, et al. Exploring visceral and subcutaneous adipose tissue secretomes in human obesity: Implications for metabolic disease[J]. Endocrinology, 2022, 163( 11): bqac140. DOI: 10.1210/endocr/bqac140. [29] MOREIRA VC, SILVA CMS, WELKER AF, et al. Visceral adipose tissue influence on health problem development and its relationship with serum biochemical parameters in middle-aged and older adults: A literature review[J]. J Aging Res, 2022, 2022: 8350527. DOI: 10.1155/2022/8350527. [30] TILG H, IANIRO G, GASBARRINI A, et al. Adipokines: Masterminds of metabolic inflammation[J]. Nat Rev Immunol, 2025, 25( 4): 250- 265. DOI: 10.1038/s41577-024-01103-8. [31] LIAO J, QIU MH, LI J, et al. Association of visceral adipose tissue with hypertension: Results from the NHANES 2011-2018 and mendelian randomization analyses[J]. J Clin Hypertens(Greenwich), 2025, 27( 1): e14953. DOI: 10.1111/jch.14953. [32] SERAVALLE G, GRASSI G. Obesity and hypertension[J]. Pharmacol Res, 2017, 122: 1- 7. DOI: 10.1016/j.phrs.2017.05.013. [33] THETHI T, KAMIYAMA M, KOBORI H. The link between the renin-angiotensin-aldosterone system and renal injury in obesity and the metabolic syndrome[J]. Curr Hypertens Rep, 2012, 14( 2): 160- 169. DOI: 10.1007/s11906-012-0245-z. [34] SHARIQ OA, MCKENZIE TJ. Obesity-related hypertension: A review of pathophysiology, management, and the role of metabolic surgery[J]. Gland Surg, 2020, 9( 1): 80- 93. DOI: 10.21037/gs.2019.12.03. [35] GARCÍA-SÁNCHEZ A, GÁMEZ-NAVA JI, DÍAZ-DE LA CRUZ EN, et al. The effect of visceral abdominal fat volume on oxidative stress and proinflammatory cytokines in subjects with normal weight, overweight and obesity[J]. Diabetes Metab Syndr Obes, 2020, 13: 1077- 1087. DOI: 10.2147/DMSO.S245494. [36] LOPERENA R, HARRISON DG. Oxidative stress and hypertensive diseases[J]. Med Clin North Am, 2017, 101( 1): 169- 193. DOI: 10.1016/j.mcna.2016.08.004. [37] LOPERENA R, VAN BEUSECUM JP, ITANI HA, et al. Hypertension and increased endothelial mechanical stretch promote monocyte differentiation and activation: Roles of STAT3, interleukin 6 and hydrogen peroxide[J]. Cardiovasc Res, 2018, 114( 11): 1547- 1563. DOI: 10.1093/cvr/cvy112. -

 本文二维码
本文二维码
计量
- 文章访问数: 389
- HTML全文浏览量: 154
- PDF下载量: 97
- 被引次数: 0