
 PDF下载 ( 2973 KB)

脂质蓄积指数、内脏脂肪指数对非酒精性脂肪性肝病的预测价值
DOI: 10.3969/j.issn.1001-5256.2022.01.020
利益冲突声明:本研究不存在研究者、伦理委员会成员、受试者监护人以及与公开研究成果有关的利益冲突。
作者贡献声明:段绍杰、姚树坤进行文章的构思与设计;段绍杰、陈佳良进行数据收集整理、统计学分析并撰写论文;姚树坤、刘尊敬进行论文修订、质量控制及审校。
Value of lipid accumulation product and visceral fat index in predicting nonalcoholic fatty liver disease
-
摘要:
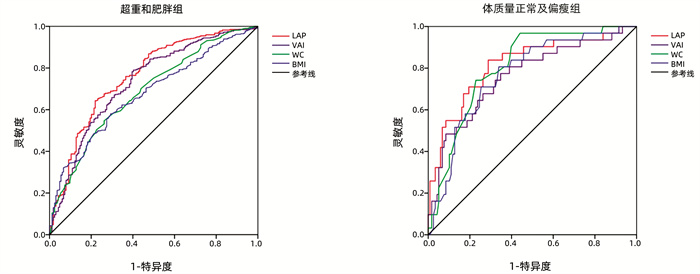
目的 探讨脂质蓄积指数(LAP)和内脏脂肪指数(VAI)与非酒精性脂肪性肝病(NAFLD)的相关性,并评估其对NAFLD患病风险的预测价值。 方法 随机纳入2018年9月—2019年5月北京中日友好医院的708例体检受试者,分为NAFLD组(n=426)和非NAFLD组(n=282),比较两组间LAP、VAI及相关生化指标差异。计量资料符合正态分布的2组间比较采用t检验,不符合正态分布者2组间比较采用Mann-Whitney U秩和检验。计数资料2组间比较采用χ2检验。应用Spearman进行相关性分析。然后将LAP、VAI根据四分位数水平分为四组(L1~L4;V1~V4),比较各组间NAFLD的分布情况,采用logistic回归分析计算不同LAP、VAI水平NAFLD的发生风险,绘制不同性别和体质量亚组LAP、VAI、腰围(WC)、体质量指数(BMI)预测NAFLD的ROC曲线,以评估各指标对NAFLD的预测诊断价值。 结果 NAFLD组受试者的年龄、男性、吸烟史占比以及LAP、VAI、WC、BMI、收缩压(SBP)、舒张压(DBP)、ALT、AST、总胆固醇(TC)、甘油三酯(TG)、低密度脂蛋白胆固醇(LDL-C)、空腹血糖(FBG)、血尿酸(SUA)水平均显著高于非NAFLD组,而高密度脂蛋白胆固醇(HDL-C)水平显著低于非NAFLD组(P值均<0.01)。NAFLD与LAP、VAI水平呈正相关(Cramer’s V值分别为0.552、0.464)。多因素logistic回归显示,在调整各危险因素后,L4组NAFLD发生风险仍为L1组的8.811(95%CI:4.335~17.910)倍(P<0.001),V4组NAFLD发生风险仍为V1组的5.967(95%CI:3.263~10.912)倍(P<0.001)。ROC曲线结果显示,不同性别和体质量亚组中LAP、VAI预测NAFLD发生的AUC均>0.7。其中,女性亚组LAP、VAI预测NAFLD的AUC显著高于男性亚组(0.886 vs 0.785,0.824 vs 0.748,P值均<0.05),且对应的灵敏度(79.8% vs 63.7%,77.9% vs 77.0%)、特异度(85.0% vs 81.1%,77.6% vs 62.3%)也偏高。 结论 NAFLD患病风险随着LAP、VAI水平增高而升高;LAP、VAI对不同性别和体质量亚组的NAFLD的发生均有良好预测价值,且对女性NAFLD的预测能力更佳。 Abstract:Objective To investigate the association of lipid accumulation product (LAP) and visceral fat index (VAI) with nonalcoholic fatty liver disease (NAFLD) and the value of LAP and VAI in predicting the risk of NAFLD. Methods A total of 708 subjects who underwent physical examination in China-Japan Friendship Hospital from September 2018 to May 2019 were enrolled and divided into NAFLD group (n=426) and non-NAFLD group (n=282), and the two groups were compared in terms of LAP, VAI, and related biochemical parameters. The independent samples t-test was used for comparison of normally distributed continuous data between groups, and the Mann-Whitney U test was used for comparison of non-normally distributed continuous data between groups.The chi-square test was used for comparison of categorical data between groups. The Spearman test was used for correlation analysis. The subjects were divided into L1-L4 groups based on LAP and V1-V4 groups based on VAI, and the distribution of NAFLD was compared between groups; a logistic regression analysis was used to calculate the risk of NAFLD at different levels of LAP and VAI, and the receiver operating characteristic (ROC) curves were plotted for LAP, VAI, waist circumference (WC), and body mass index (BMI) in predicting NAFLD in different sex and body weight subgroups, so as to evaluate the value of each index in the prediction and diagnosis of NAFLD. Results Compared with the non-NAFLD group, the NAFLD group had significantly higher age, proportion of male subjects, proportion of subjects with a smoking history, and levels of LAP, VAI, WC, BMI, systolic blood pressure, diastolic blood pressure, alanine aminotransferase, aspartate aminotransferase, total cholesterol, triglyceride, low-density lipoprotein cholesterol, fasting blood glucose, and serum uric acid, as well as a significantly lower level of high-density lipoprotein cholesterol (all P < 0.01). NAFLD was positively correlated with the levels of LAP and VAI (Cramer's V=0.552 and 0.464). The multivariate logistic regression analysis showed that after adjustment for related risk factors, the risk of NAFLD in the L4 group was still 8.811 (95% confidence interval [CI]: 4.335-17.910) times that in the L1 group (P < 0.001), and the risk of NAFLD in the V4 group was still 5.967 (95% CI: 3.263-10.912) times than that in the V1 group (P < 0.001). The ROC curve analysis showed that both LAP and VAI had an area under the ROC curve (AUC) of > 0.7 in predicting the onset of NAFLD in different sex and body weight subgroups; the AUCs of LAP and VAI in the female subgroup were significantly higher than those in the male subgroup (LAP: 0.886 vs 0.785, P < 0.05; VAI: 0.824 vs 0.748, P < 0.05), and the corresponding sensitivities and specificities of LAP and VAI in the female subgroup were also higher than those in the male subgroup (sensitivity: LAP: 79.8% vs 63.7%; VAI: 77.9% vs 77.0%; specificity: LAP: 85.0% vs 81.1%; VAI: 77.6% vs 62.3%). Conclusion The risk of NAFLD increases with the increase in the levels of LAP and VAI. Both LAP and VAI have a good value in predicting NAFLD in different sex and body weight subgroups, especially in predicting NAFLD in the female population. -
表 1 受试者基线资料分析
指标 NAFLD组(n=426) 非NAFLD组(n=282) 统计值 P值 男[例(%)] 299(75.6) 198(62.1) χ2=14.848 <0.001 年龄(岁) 40.25±10.67 37.54±20.21 t=3.398 0.001 吸烟史[例(%)] 143(33.6) 63(22.3) χ2=10.368 0.001 LAP 61.30(40.14~87.79) 26.02(15.09~40.58) Z=-14.659 <0.001 VAI 2.31(1.60~3.51) 1.20(0.84~1.83) Z=-12.531 <0.001 WC(cm) 97.31±8.58 87.23±9.62 t=14.241 <0.001 BMI(kg/m2) 28.07±3.24 24.55±3.24 t=14.155 <0.001 SBP (mmHg) 133.21±16.34 126.22±14.88 t=5.772 <0.001 DBP (mmHg) 87.23±9.62 78.46±11.67 t=4.809 <0.001 ALT(U/L) 45.10±35.18 24.77±15.91 t=10.418 <0.001 AST(U/L) 26.66±16.27 20.70±10.58 t=5.891 <0.001 TC(mmol/L) 4.69±0.87 4.42±0.78 t=4.350 <0.001 TG(mmol/L) 2.14±1.36 1.27±0.90 t=10.264 <0.001 HDL-C (mmol/L) 1.19±0.27 1.34±0.30 t=-6.985 <0.001 LDL-C (mmol/L) 2.87±0.91 2.60±0.69 t=4.219 <0.001 FBG (mmol/L) 5.71±1.42 5.24±0.69 t=5.777 <0.001 SUA(μmol/L) 378.46±86.16 332.04±88.36 t=6.947 <0.001  下载: 导出CSV
表 2 LAP及VAI四分位水平分组中NAFLD的分布情况
项目 LAP VAI L1 L2 L3 L4 V1 V2 V3 V4 NAFLD[例(%)] 31(17.5) 136(57.6)1) 136(76.8)1)2) 157(88.7)1)2)3) 45(25.4) 99(55.9)4) 130(73.4)4)5) 152(85.9)4)5)6) 非NAFLD[例(%)] 146(82.5) 75(42.4) 41(23.2) 20(11.3) 132(74.6) 78(44.1) 47(26.6) 25(14.1) 注:与L1比较,1)P<0.05;与L2比较,2)P<0.05;与L3比较,3)P<0.05;与V1比较;4)P<0.05;与V2比较,5)P<0.05;与V3比较,6)P<0.05。
下载: 导出CSV
表 3 LAP、VAI与各生化指标的相关性
项目 统计值 ALT AST TC TG HDL-C LDL-C FBG SUA SBP SDP LAP r值 0.360 0.253 0.293 0.939 -0.207 0.140 0.242 0.359 0.273 0.233 P值 <0.001 <0.001 <0.001 <0.001 <0.001 <0.001 <0.001 <0.001 <0.001 <0.001 VAI r值 0.257 0.170 0.207 0.897 -0.419 0.126 0.221 0.315 0.214 0.199 P值 <0.001 <0.001 <0.001 <0.001 <0.001 <0.001 <0.001 <0.001 <0.001 <0.001
下载: 导出CSV
表 4 不同LAP、VAI水平NAFLD发生风险的logistic回归分析
项目 模型1 模型2 OR(95%CI) P值 OR(95%CI) P值 LAP L1 1 1 L2 6.405(3.928~10.445) <0.001 3.428(2.000~5.876) <0.001 L3 15.622(9.272~26.322) <0.001 6.659(3.688~12.025) <0.001 L4 36.971(20.176~67.745) <0.001 8.811(4.335~17.910) <0.001 VAI V1 1 1 V2 3.436(2.178~5.420) <0.001 2.16(1.295~3.602) 0.003 V3 7.598(4.702~12.276) <0.001 3.478(2.019~5.989) <0.001 V4 15.843(9.167~27.382) <0.001 5.967(3.263~10.912) <0.001
下载: 导出CSV
表 5 不同性别受试者各指标预测NAFLD发生风险的ROC曲线的结果分析
指标 AUC 95%CI 灵敏度(%) 特异度(%) 最大约登指数 临界值 男性 LAP 0.785 0.742~0.828 63.7 81.1 0.448 50.88 VAI 0.748 0.702~0.794 77.0 62.3 0.393 1.559 WC 0.748 0.702~0.793 70.8 66.3 0.371 93.25 cm BMI 0.748 0.703~0.792 71.7 64.6 0.363 26.35 kg/m2 女性 LAP 0.8861) 0.840~0.932 79.8 85.0 0.648 35.62 VAI 0.8242) 0.767~0.881 77.9 77.6 0.555 1.569 WC 0.8333) 0.780~0.887 87.5 65.4 0.529 85.75 cm BMI 0.814 0.757~0.871 82.7 68.2 0.509 24.59 kg/m2 注:与男性LAP比较,1)P<0.05;与男性VAI比较,2)P<0.05;与男性WC比较,3)P<0.05。
下载: 导出CSV
表 6 不同体质量亚组各指标预测NAFLD发生风险的ROC曲线的结果分析
指标 AUC 95%CI 灵敏度(%) 特异度(%) 最大约登指数 临界值 超重和肥胖组 LAP 0.7611)2) 0.716~0.805 64.3 78.0 0.423 50.91 VAI 0.732 0.685~0.778 79.0 59.8 0.388 1.562 WC 0.687 0.639~0.734 54.7 73.8 0.285 96.25 cm BMI 0.676 0.629~0.722 58.0 71.7 0.287 27.52 kg/m2 体质量正常及偏瘦组 LAP 0.816 0.726~0.905 83.9 71.2 0.551 21.93 VAI 0.760 0.660~0.860 77.4 65.3 0.427 1.134 WC 0.8051) 0.727~0.882 96.8 55.9 0.527 80.50 cm BMI 0.768 0.679~0.857 80.6 66.1 0.467 22.47 kg/m2 注:与超重和肥胖组WC比较,1)P<0.05;与超重和肥胖组BMI比较,2)P<0.05。
下载: 导出CSV
-
[1] CHALASANI N, YOUNOSSI Z, LAVINE JE, et al. The diagnosis and management of nonalcoholic fatty liver disease: Practice guidance from the American Association for the Study of Liver Diseases[J]. Hepatology, 2018, 67(1): 328-357. DOI: 10.1002/hep.29367. [2] SAKLAYEN MG. The global epidemic of the metabolic syndrome[J]. Curr Hypertens Rep, 2018, 20(2): 12. DOI: 10.1007/s11906-018-0812-z. [3] RINELLA ME. Nonalcoholic fatty liver disease: A systematic review[J]. JAMA, 2015, 313(22): 2263-2273. DOI: 10.1001/jama.2015.5370. [4] LIU C, ZANG LJ. Research progress of new type body fat indexes of lipid accumulation product index and visceral adiposity index[J]. Chin J Diabetes, 2016, 24(11): 1032-1035. DOI: 10.3969/j.issn.1006-6187.2016.11.16.刘晨, 张黎军. 新型体脂指数脂质蓄积指数和内脏脂肪指数的相关研究进展[J]. 中国糖尿病杂志, 2016, 24(11): 1032-1035. DOI: 10.3969/j.issn.1006-6187.2016.11.16. [5] National Workshop on Fatty Liver and Alcoholic Liver Disease, Chinese Society of Hepatology, Chinese Medical Association, Fatty Liver Expert Committee, Chinese Medical Doctor Association. Guidelines of prevention and treatment for nonalcoholic fatty liver disease: A 2018 update[J]. J Clin Hepatol, 2018, 34(5): 947-957. DOI: 10.3969/j.issn.1001-5256.2018.05.007.中华医学会肝病学分会脂肪肝和酒精性肝病学组, 中国医师协会脂肪性肝病专家委员会. 非酒精性脂肪性肝病防治指南(2018年更新版)[J]. 临床肝胆病杂志, 2018, 34(5): 947-957. DOI: 10.3969/j.issn.1001-5256.2018.05.007. [6] ZHANG Y, LI B, LIU N, et al. Evaluation of different anthropometric indicators for screening for nonalcoholic fatty liver disease in elderly individuals[J]. Int J Endocrinol, 2021, 2021: 6678755. DOI: 10.1155/2021/6678755. [7] VURAL KESKINLER M, MUTLU HH, SIRIN A, et al. Visceral adiposity index as a practical tool in patients with biopsy-proven nonalcoholic fatty liver disease/nonalcoholic steatohepatitis[J]. Metab Syndr Relat Disord, 2021, 19(1): 26-31. DOI: 10.1089/met.2020.0054. [8] DAI H, WANG W, CHEN R, et al. Lipid accumulation product is a powerful tool to predict non-alcoholic fatty liver disease in Chinese adults[J]. Nutr Metab (Lond), 2017, 14: 49. DOI: 10.1186/s12986-017-0206-2. [9] ÖZCAB1 B, DEMIRHAN S, AKYOL M, et al. Lipid accumulation product is a predictor of nonalcoholic fatty liver disease in childhood obesity[J]. Korean J Pediatr, 2019, 62(12): 450-455. DOI: 10.3345/kjp.2019.00248. [10] OKAMURA T, HASHIMOTO Y, HAMAGUCHI M, et al. The visceral adiposity index is a predictor of incident nonalcoholic fatty liver disease: A population-based longitudinal study[J]. Clin Res Hepatol Gastroenterol, 2020, 44(3): 375-383. DOI: 10.1016/j.clinre.2019.04.002. [11] XU C, MA Z, WANG Y, et al. Visceral adiposity index as a predictor of NAFLD: A prospective study with 4-year follow-up[J]. Liver Int, 2018, 38(12): 2294-2300. DOI: 10.1111/liv.13941. [12] VONGSUVANH R, GEORGE J, MCLEOD D, et al. Visceral adiposity index is not a predictor of liver histology in patients with non-alcoholic fatty liver disease[J]. J Hepatol, 2012, 57(2): 392-398. DOI: 10.1016/j.jhep.2012.03.013. [13] CASTERA L, FRIEDRICH-RUST M, LOOMBA R. Noninvasive assessment of liver disease in patients with nonalcoholic fatty liver disease[J]. Gastroenterology, 2019, 156(5): 1264-1281. e4. DOI: 10.1053/j.gastro.2018.12.036. [14] ZHOU YJ, ZHOU YF, ZHENG JN, et al. NAFL screening score: A basic score identifying ultrasound-diagnosed non-alcoholic fatty liver[J]. Clin Chim Acta, 2017, 475: 44-50. DOI: 10.1016/j.cca.2017.09.020. [15] YIP TC, MA AJ, WONG VW, et al. Laboratory parameter-based machine learning model for excluding non-alcoholic fatty liver disease (NAFLD) in the general population[J]. Aliment Pharmacol Ther, 2017, 46(4): 447-456. DOI: 10.1111/apt.14172. [16] GHOSH A, GAO L, THAKUR A, et al. Role of free fatty acids in endothelial dysfunction[J]. J Biomed Sci, 2017, 24(1): 50. DOI: 10.1186/s12929-017-0357-5. [17] LONGO M, ZATTERALE F, NADERI J, et al. Adipose tissue dysfunction as determinant of obesity-associated metabolic complications[J]. Int J Mol Sci, 2019, 20(9): 2358. DOI: 10.3390/ijms20092358. [18] XUE R, FAN JG. Brief introduction of an international expert consensus statement: A new definition of metabolic associated fatty liver disease[J]. J Clin Hepatol, 2020, 36(6): 1224-1227. DOI: 10.3969/j.issn.1001-5256.2020.06.007.薛芮, 范建高. 代谢相关脂肪性肝病新定义的国际专家共识简介[J]. 临床肝胆病杂志, 2020, 36(6): 1224-1227. DOI: 10.3969/j.issn.1001-5256.2020.06.007. -

 本文二维码
本文二维码

图(2) / 表(6)
计量
- 文章访问数: 628
- HTML全文浏览量: 109
- PDF下载量: 91
- 被引次数: 0

